Knowledge we build together Honest and transparent Real people, real data

My data: seven months of readings

Author: StoffwechselFitUpdated: July 2026Type: Own measurement (n=1)
Topic illustration: My data: seven months of readingsAI image
Illustration: AI-assisted, editorially reviewed

Seven months, one sensor, no medication. This page shows how my readings changed — with the reports from the app, exactly as they appear there.

What this is and what it is not

A single-case record. I show what happened to me, not what will happen to you. What I changed — food, movement, sleep — worked in my situation. Whether it works in yours is a question for your medical team.

Seven months in figures

146

The percentages in this article are calculated from the raw sensor export, not read off the app screens. The app uses the configured target range of 70 to 160 mg/dl and therefore shows different shares.

mg/dl · January
Monthly average at the start
119
mg/dl · July
Monthly average at the end
-27
mg/dl · change
Difference over seven months
99 %
in range 70–160
July, up from 81 per cent in January

Calculated from the raw sensor export — not read off the app screens.

Average glucose value per monthLine chart: the monthly average falls from 146 to 119 mg/dl.100120140160146Jan141Feb135Mar129Apr131May127Jun119JulMonthly average in mg/dl
Fig.: Monthly average from 7 months of continuous measurement. Each point is based on between 6,864 and 8,895 individual readings.

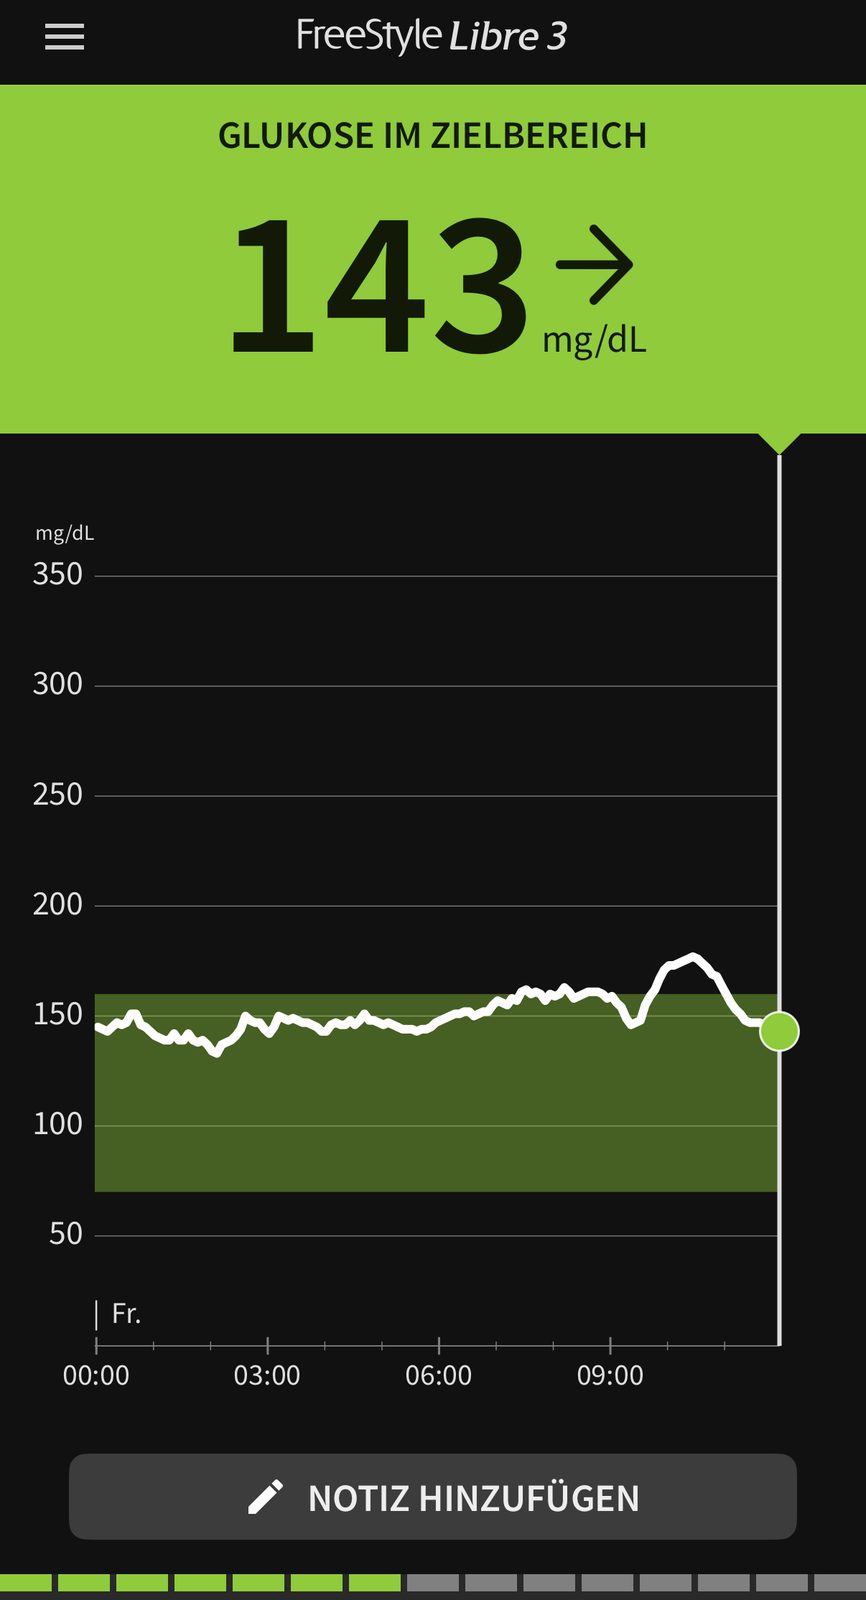
January 2026

Sensor app report, January 2026
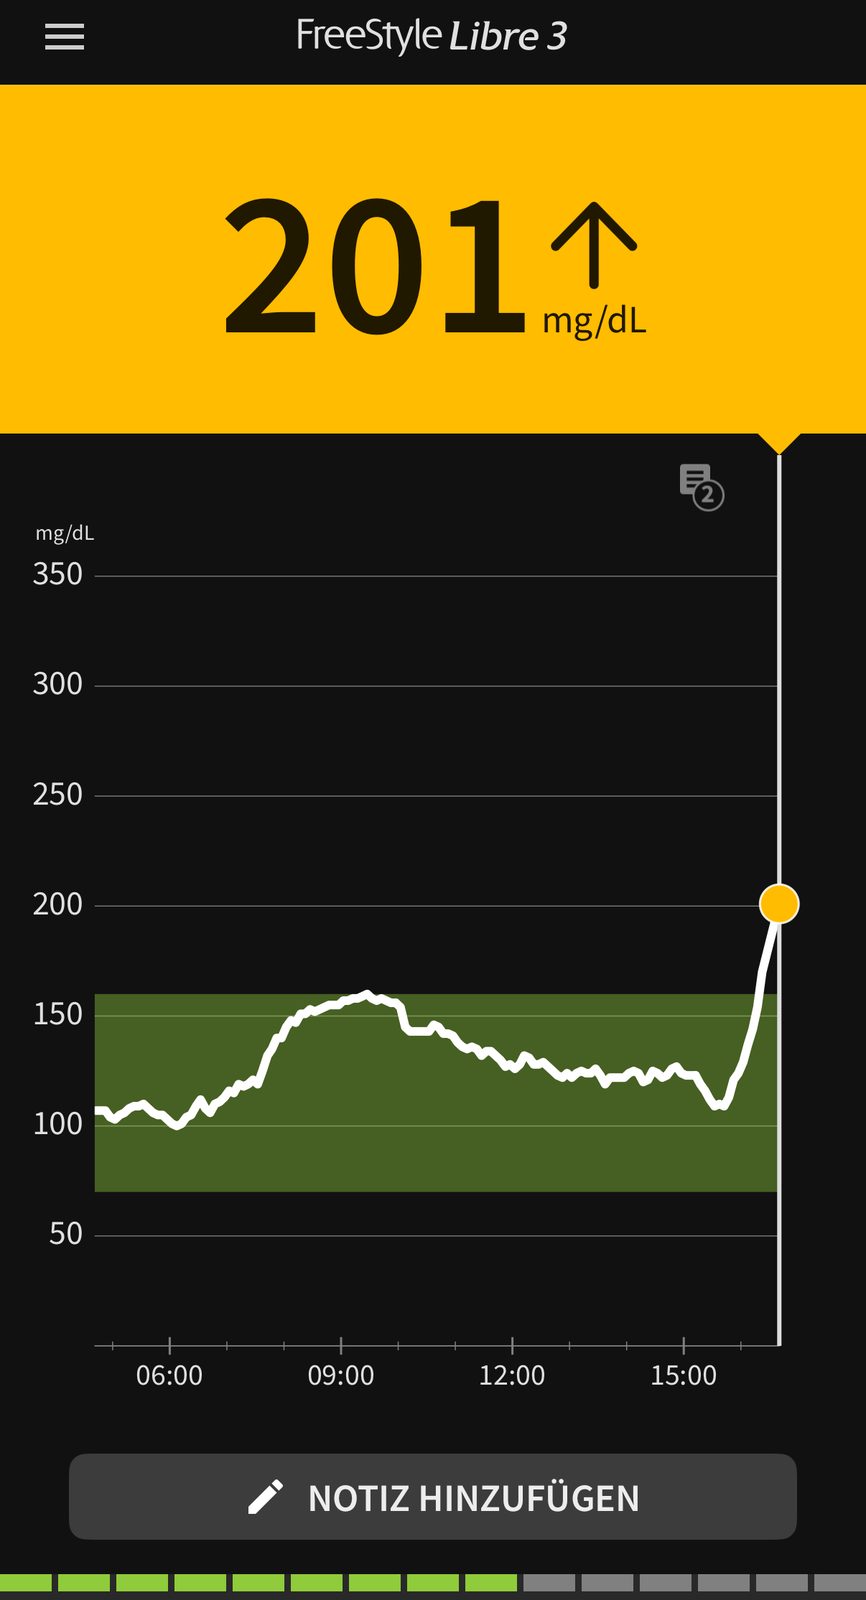
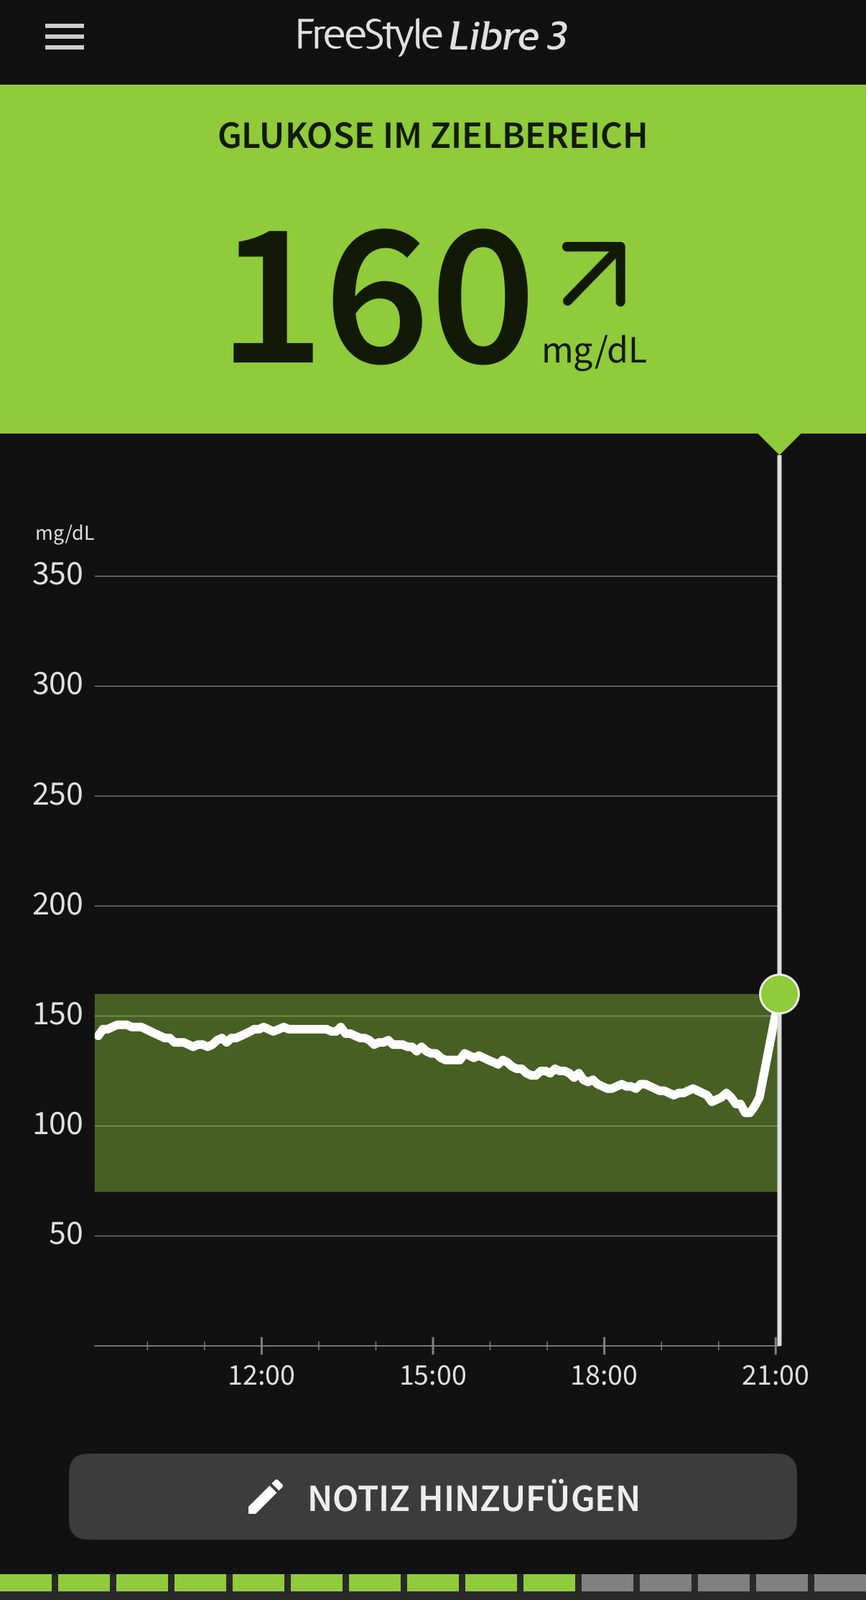
Monthly sensor-app view for January 2026. The curve and range display are visible. Values in the text come from the raw data export, not from this screenshot; the app uses a different target range.

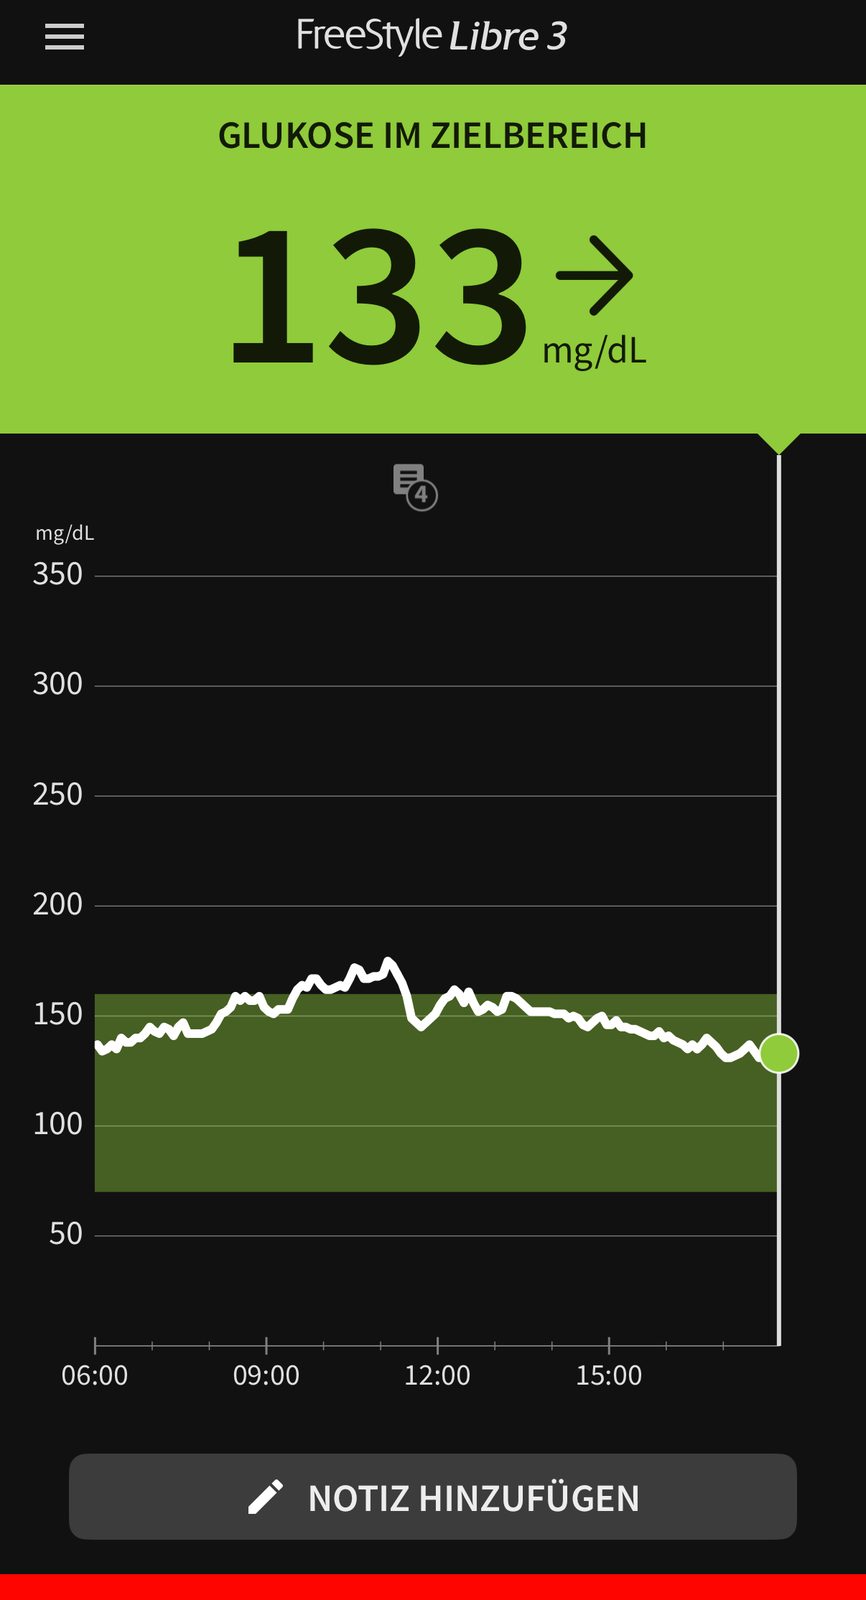
February 2026

Sensor app report, February 2026
Monthly sensor-app view for February 2026. The curve and range display are visible. Values in the text come from the raw data export, not from this screenshot; the app uses a different target range.

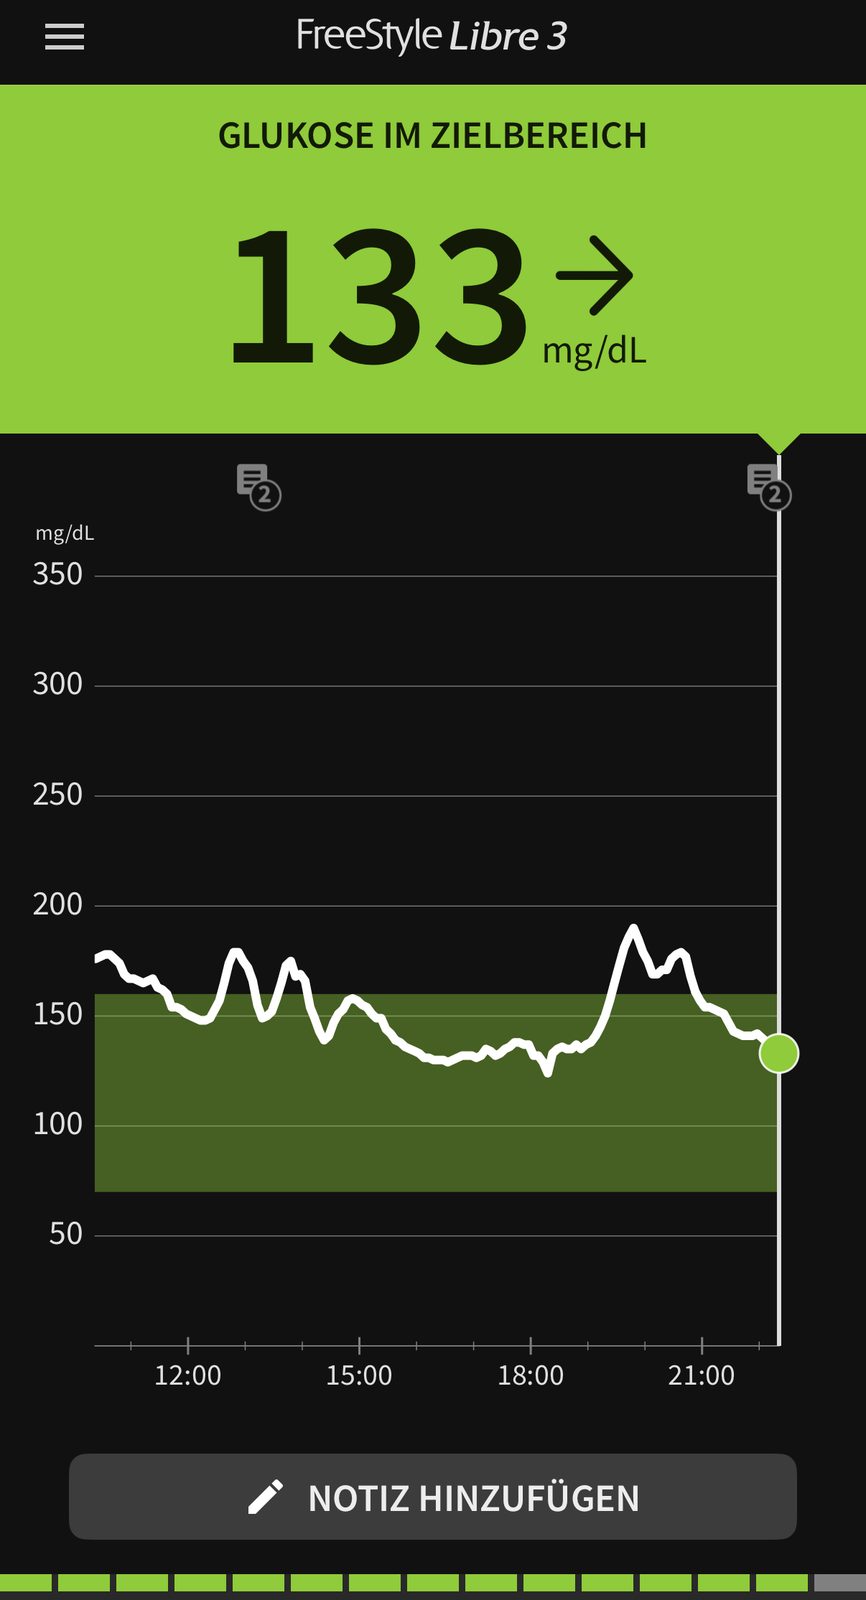
March 2026

Sensor app report, March 2026
Monthly sensor-app view for March 2026. The curve and range display are visible. Values in the text come from the raw data export, not from this screenshot; the app uses a different target range.

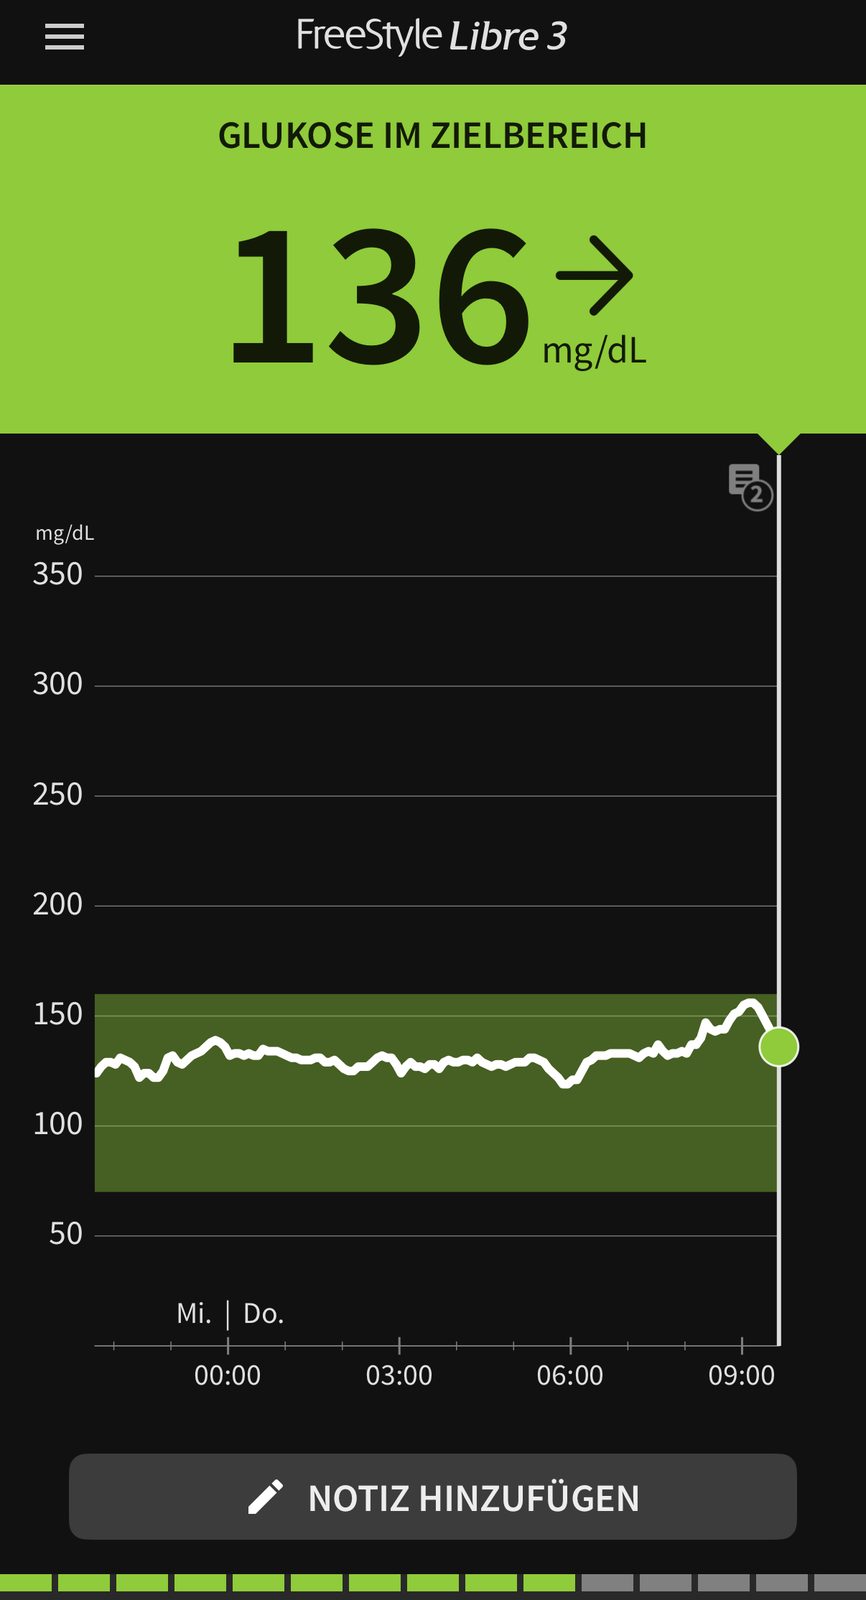
April 2026

Sensor app report, April 2026
Monthly sensor-app view for April 2026. The curve and range display are visible. Values in the text come from the raw data export, not from this screenshot; the app uses a different target range.

May 2026

Sensor app report, May 2026
Monthly sensor-app view for May 2026. The curve and range display are visible. Values in the text come from the raw data export, not from this screenshot; the app uses a different target range.

June 2026

Sensor app report, June 2026
Monthly sensor-app view for June 2026. The curve and range display are visible. Values in the text come from the raw data export, not from this screenshot; the app uses a different target range.

July 2026

Sensor app report, July 2026
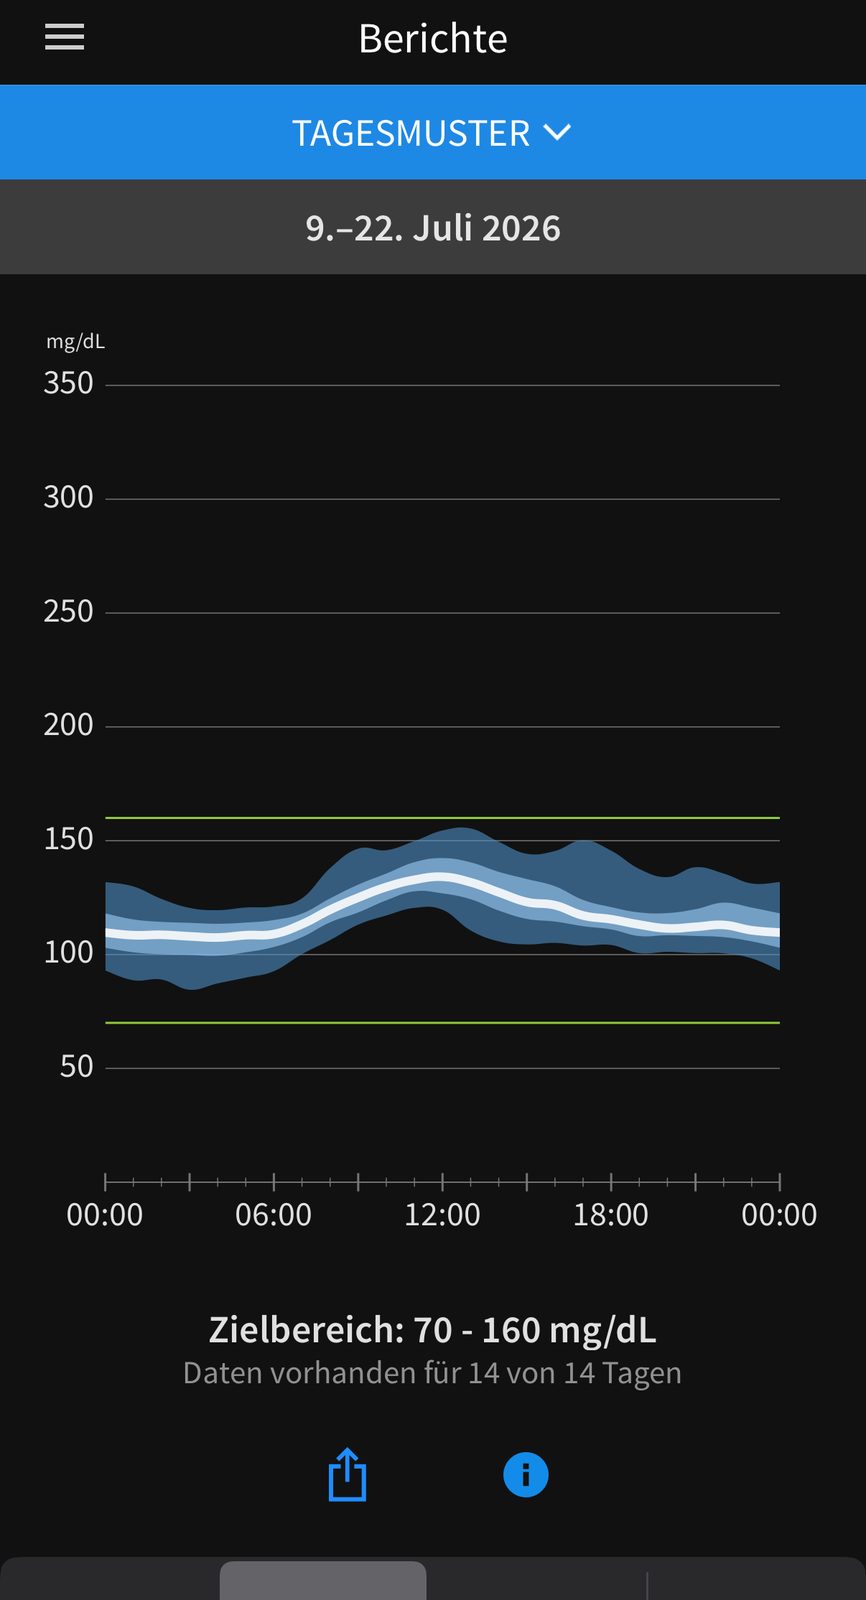
Monthly sensor-app view for July 2026. The curve and range display are visible. Values in the text come from the raw data export, not from this screenshot; the app uses a different target range.

What changed during this time

Three things I kept up: a twenty-minute walk after larger meals, fewer carbohydrates at dinner, and regular training — steady endurance work plus strength sessions.

What I did not do: skip meals, go hungry, or treat supplements as a substitute.

How to read this

These reports show a development over seven months. They do not show which single measure contributed how much — separating the influences is not possible in everyday life. Season, stress and sleep play their part too.

Key points

  • Seven months of continuous measurement with the same type of sensor.
  • Time in range increased noticeably over this period.
  • What changed: movement after meals, the composition of dinner, and training.
  • A single observation — no reliable proof that it works the same way for others.

Single-case record, not a study.

🔍 How I read this data

The values in this article come from my own sensor (FreeStyle Libre 3) and are a single-case observation (n = 1) – they show a pattern in me, not a rule for you. Every statement is labelled as established, plausible or open, and proximity in time never counts as proof of a cause. How I handle time windows, sensor lag, influencing factors and approval is collected on one page. Read the methodology

Sources

This entry is based on my own sensor readings. Where studies are mentioned, they are linked in the text. Continuous glucose monitoring: FreeStyle Libre 3.

Recalculated from the complete CSV export

Monthly mean and time 70–160 mg/dl146.5Jan81.3%141.0Feb80.8%135.4Mar91.9%128.6Apr97.5%130.8May96.4%127.4Jun97.7%119.2Jul*99.3%* July through 24 July; percentage below month = time 70–160 mg/dl.
Actual monthly values from 89,488 continuous glucose readings. July ends on 24 July 2026.

The earlier image selection included daily screenshots that could be mistaken for monthly summaries. This graph uses only the CSV export. Calculated GMI is a CGM estimate, not a laboratory HbA1c.

General information, not medical advice. Remission is not a cure; never stop medication on your own.

Share this article

Direct links — no external tracking scripts loaded.