Why a protocol at all
I could simply have written: flavour A drives my blood sugar, flavour B does not. That would have been shorter and would have sounded like a result. It just would not have been one.
More differs between two mornings than the powder in the tub. Sleep was different, the temperature was different, the previous evening was different. If I see a difference of ten or twenty points, I need to be able to rule out that it came from one of those – otherwise I am describing chance and calling it insight.
That is why this article comes before the results and not after them. Anyone reading the design only after the numbers believes it less – rightly so.
The test design
The sequence is the one I ride every morning anyway: get up, read and note the value, protein drink with 300 ml of unsweetened almond drink, then 45 minutes of low impact riding at level two straight afterwards. No breakfast beforehand, no other liquid, same time of day.
This routine is the real advantage of the test. It has existed for months and was not invented for the experiment. A protocol set up solely for a test rarely survives three repetitions; one that is already running does.
What I measure
Four points per morning, all noted directly in the app rather than later from memory: the starting value before the drink, the highest value in the curve with its time, the value after the cool-down, and when the starting value is reached again.
The last point is the one I used to leave out. The peak alone says little – two curves of the same height can behave entirely differently if one is back after forty minutes and the other after two hours. What matters is the area, not the point.
| Measurement | When | Why |
|---|---|---|
| Starting value | before the drink | the baseline; without it the rise cannot be quantified |
| Peak value | during the curve | the peak with its time, not just the number |
| Value after cool-down | approx. 55 min after the start | what the training absorbed |
| Return to baseline | open | the duration – the most informative part |
| Note | immediately | flavour, amount, time; memory is unreliable |
The mistake in the first round
I have to say this openly, because otherwise nobody notices and the article sounds better than it is: in the first comparison I changed two things at once. Not only the flavour but also the amount – of the second flavour I took almost double the portion.
That makes the most interesting finding simultaneously the weakest. That more powder produced a smaller spike is remarkable and fits what is known about fat, fibre and whey protein.4 It proves nothing. It could be the flavour, it could be the amount, it could be both together – or neither, but the previous evening.
A test protocol that shows only the successful rounds is advertising. The first round was methodologically unclean, and that belongs on the record – not least because others make the same mistake. The observation remains the reason for the test. It is simply not its result.
What I know about the two flavours – and what I do not
For one flavour I have complete nutrition data, because I photographed the tub for an earlier test: per serving of 25 g of powder and 300 ml of unsweetened almond drink around 158 kcal, 19 g of protein, 4.1 g of carbohydrates of which 1.6 g sugar, 7.0 g of fat, 1.5 g of fibre and 81 mg of caffeine.
For the second flavour I so far have only one figure from an old CGM note: around 3 g of carbohydrates per serving. That is not enough for a comparison. As long as the back of the second tub is missing, I cannot even say whether the two differ in fat content or sweetening – and that is exactly where the explanation might lie.
I write this plainly because it is the second point where this test currently falls short. The first was the doubled amount. Both are fixable, neither has been fixed yet.
Why I compare flavours rather than brands
It would be obvious to test two manufacturers against each other. I am deliberately doing something else: comparing two flavours from the same manufacturer. That keeps the protein base very likely similar, and the differences are limited to aroma, sweetening and pieces.
It is not a perfect window, but a narrower one. Between two brands the protein blend, the processing and often the serving size differ as well – then you are no longer comparing two recipes but two worlds.
A second reason is practical: both flavours are in my cupboard anyway. A test that requires shopping first gets carried through less often than one that fits what is already there.
What the last test taught me about my own approach
In an earlier self-test I recorded a full morning and saw something that changed my picture: the value initially kept rising although the training had long since started. Only after about twenty minutes did it turn.
For this flavour comparison that has a practical consequence. If I note only the value at the end of the ride, I may not be measuring the effect of the powder but the point where two opposing processes happen to cross. That is why the return to baseline is in the protocol and not just the end value.
The first documented round
On 10 and 11 August I recorded two curves in full. They do not yet answer the original question – but they show what the protocol looks like when it runs cleanly, and they contain one finding I had not expected.
Monday evening: the rise and what followed
At 21:22 the value stood at 173 mg/dl with a rising arrow. I had eaten a protein yoghurt and logged it with 10 g of carbohydrates. By 21:30 the value had climbed to 183 mg/dl – that was the peak.
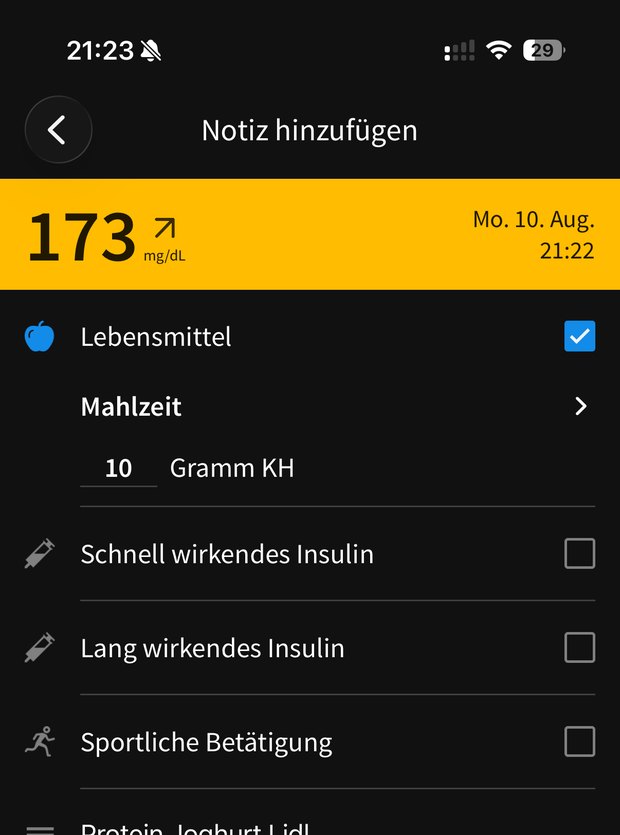
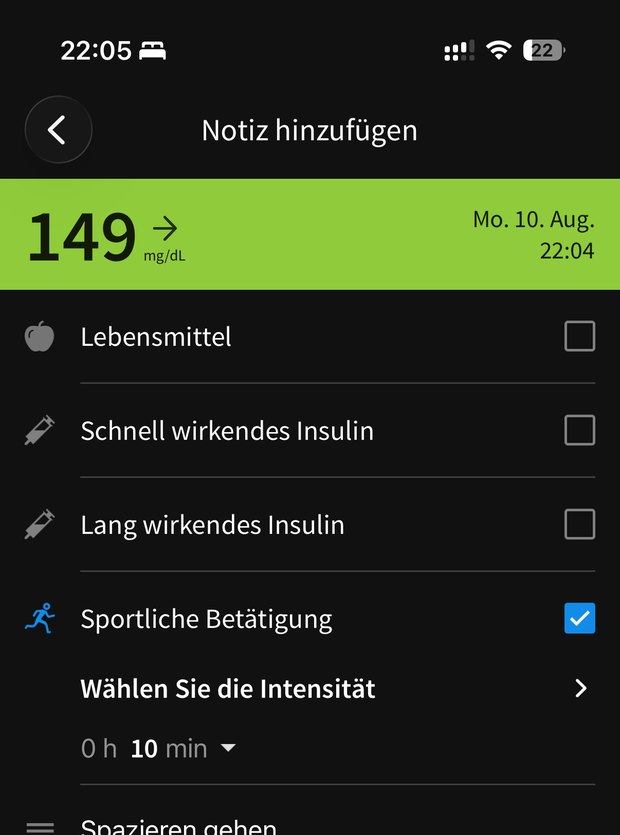
At 22:04 the value stood at 149 mg/dl, and the same note records „going for a walk“ over ten minutes. Between the peak and that point lie 34 minutes and 34 points of difference.
Tuesday morning: Dark Cookie Crumble, 400 ml
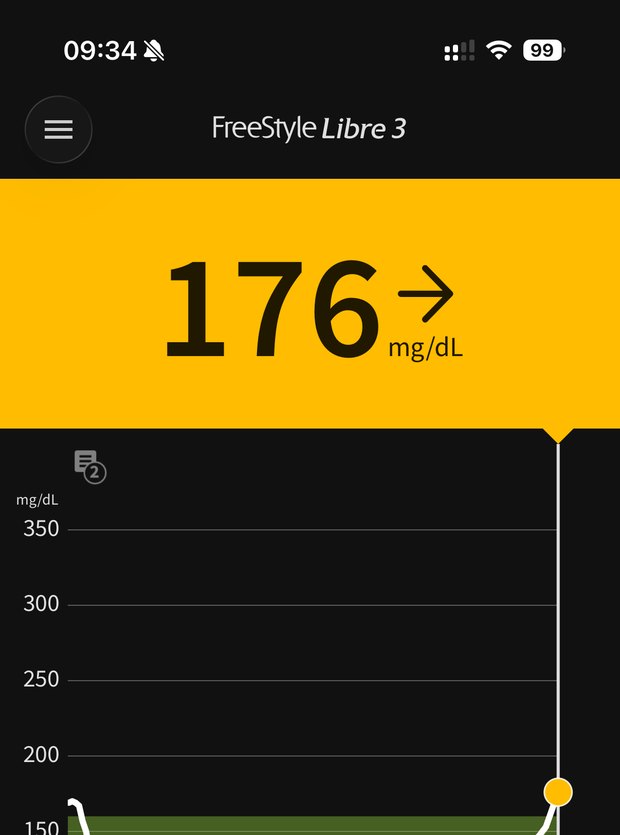
The next morning at 09:33 the value stood at 176 mg/dl. The note records „Dark Cookie Crumble 400 ml“ and 8 g of carbohydrates. By 09:42 it had risen further to 186 mg/dl.
| Time | Value | What was logged |
|---|---|---|
| Mon 21:22 | 173 mg/dl ↗ | protein yoghurt, 10 g carbs |
| Mon 21:30 | 183 mg/dl ↗ | peak of the evening |
| Mon 21:53 | 169 mg/dl → | falling |
| Mon 22:04 | 149 mg/dl → | going for a walk, 10 minutes |
| Tue 09:33 | 176 mg/dl → | Dark Cookie Crumble 400 ml, 8 g carbs |
| Tue 09:42 | 186 mg/dl → | peak, no training logged |
They show the walking effect clearly: 183 down to 149 in a good half hour. They do not show the flavour comparison this test is about. For the Tuesday morning the counterpart with the other flavour under matching conditions is missing, and at 400 ml the amount exceeded my usual portion. As a first round this works – as a comparison it does not yet.
The sources of error I cannot switch off
The previous day. What was eaten in the evening and how late reaches into the morning. With a fatty meal the peak shifts backwards and can extend into the night.
Heat and fluid intake. Dehydration concentrates the blood and raises the measured value; at high temperatures more frequent testing is expressly advised.3 In a week above thirty degrees that is no side issue.
Sleep. A single night of four hours measurably lowers insulin sensitivity.2 I usually sleep a similar length, but at twenty-seven degrees in the bedroom the quality is different – and that appears in no statistic.
The sensor phase. A CGM measures not in blood but in interstitial fluid. During rapid changes the deviation rises markedly.5 Training phases with a fast fall are therefore less precise than the smooth curve suggests.
How many rounds it takes
My target is at least three repetitions per flavour, alternating rather than in blocks. A week of flavour A followed by a week of flavour B sounds tidy but has a catch: if the weather changes in the second week or I sleep worse, that effect lands entirely on the flavour’s account.
Alternating – A, B, A, B – distributes such disturbances across both sides. That is the only trick in this design, and it costs nothing but discipline in measuring out the powder.
What this test can answer
It can show whether the two flavours produce different curves in me, and how large that difference is. That is usable information for my own morning routine.
It cannot show which ingredient is responsible. The two flavours differ in aroma, sweetening, pieces and possibly in the protein blend all at once. To isolate a single ingredient you would need products differing only in that respect – with retail goods those practically never exist.
And it certainly cannot show how somebody else responds. In a study of 800 people and almost 47,000 meals, responses to identical standardised meals differed considerably.1 My result is mine.
I train fasted and without glucose-lowering medication. Anyone taking insulin or sulfonylureas starts from a different position: there, fasted training can lead to a genuine hypo because the medication keeps working. Such trials belong in a prior conversation with a doctor – not in a decision made after a blog article.
Why I publish this before the numbers exist
There is an uncomfortable effect in self-experiments that I have observed in myself: anyone who measures first and then decides what to analyse almost always finds something. You set the boundaries afterwards so that a pattern emerges – not out of dishonesty, but because the brain looks for patterns.
The only protection against that is to fix the design beforehand and then leave it alone. If I write in advance that I will run three rounds per flavour with the same amount and note four specific points, I cannot quietly change the rules afterwards because the result displeases me.
That is the real purpose of this article. It is not a preview of a result but a commitment.
What happens next
The series is running. As soon as at least three clean rounds per flavour are in – same amount, alternating, with the full curve through to the return – I will publish the numbers with the screenshots, as with the previous tests.
Until then the trigger remains what it is: an observation that occupied me. Not a result, not a recommendation, not a verdict on a product. Anyone wanting to know why two shakes can act differently at all will find the mechanisms in the accompanying knowledge article – which sets out what is documented, independently of my values.
The essentials at a glance
- Trigger: a week on the same flavour with a clear morning spike, then a different flavour with a smaller spike despite almost double the amount.
- Held constant: time of day, 300 ml of unsweetened almond drink, 45 minutes of low impact at level two straight afterwards, a fasted start.
- Four points are measured: starting value, peak with its time, value after cool-down, and the return to baseline.
- Methodological mistake in the first round: flavour and amount were changed at once – so no cause can be attributed.
- Four confounders remain: the previous day, heat and fluid intake, sleep quality, and sensor accuracy during rapid changes.
- At least three rounds per flavour are planned, alternating rather than in blocks.
- The test can show whether a difference exists – not which ingredient causes it.
Sources
Sources as of: 26 Jul 2026.
- Zeevi D. et al.: Personalized Nutrition by Prediction of Glycemic Responses. Cell 163(5):1079-1094 (2015). The blood sugar response to identical standardised meals differed considerably across 800 participants. cell.com (opens in a new window)
- Donga E. et al.: A Single Night of Partial Sleep Deprivation Induces Insulin Resistance in Multiple Metabolic Pathways in Healthy Subjects. J Clin Endocrinol Metab 95(6):2963-2968 (2010). academic.oup.com/jcem (opens in a new window)
- Diabetes UK / Diabetes.co.uk: heat and diabetes – dehydration can raise blood sugar; more frequent testing is advised at high temperatures. diabetes.co.uk (opens in a new window)
- Salehi A. et al.: The insulinogenic effect of whey protein is partially mediated by a direct effect of amino acids and GIP on β-cells. Nutr Metab 9:48 (2012). ncbi.nlm.nih.gov/PMC3471010 (opens in a new window)
- Accuracy of continuous glucose monitoring at high rates of change: above 3 mg/dl/min the mean absolute relative difference rises markedly. PMC. ncbi.nlm.nih.gov/PMC7199533 (opens in a new window)