The product
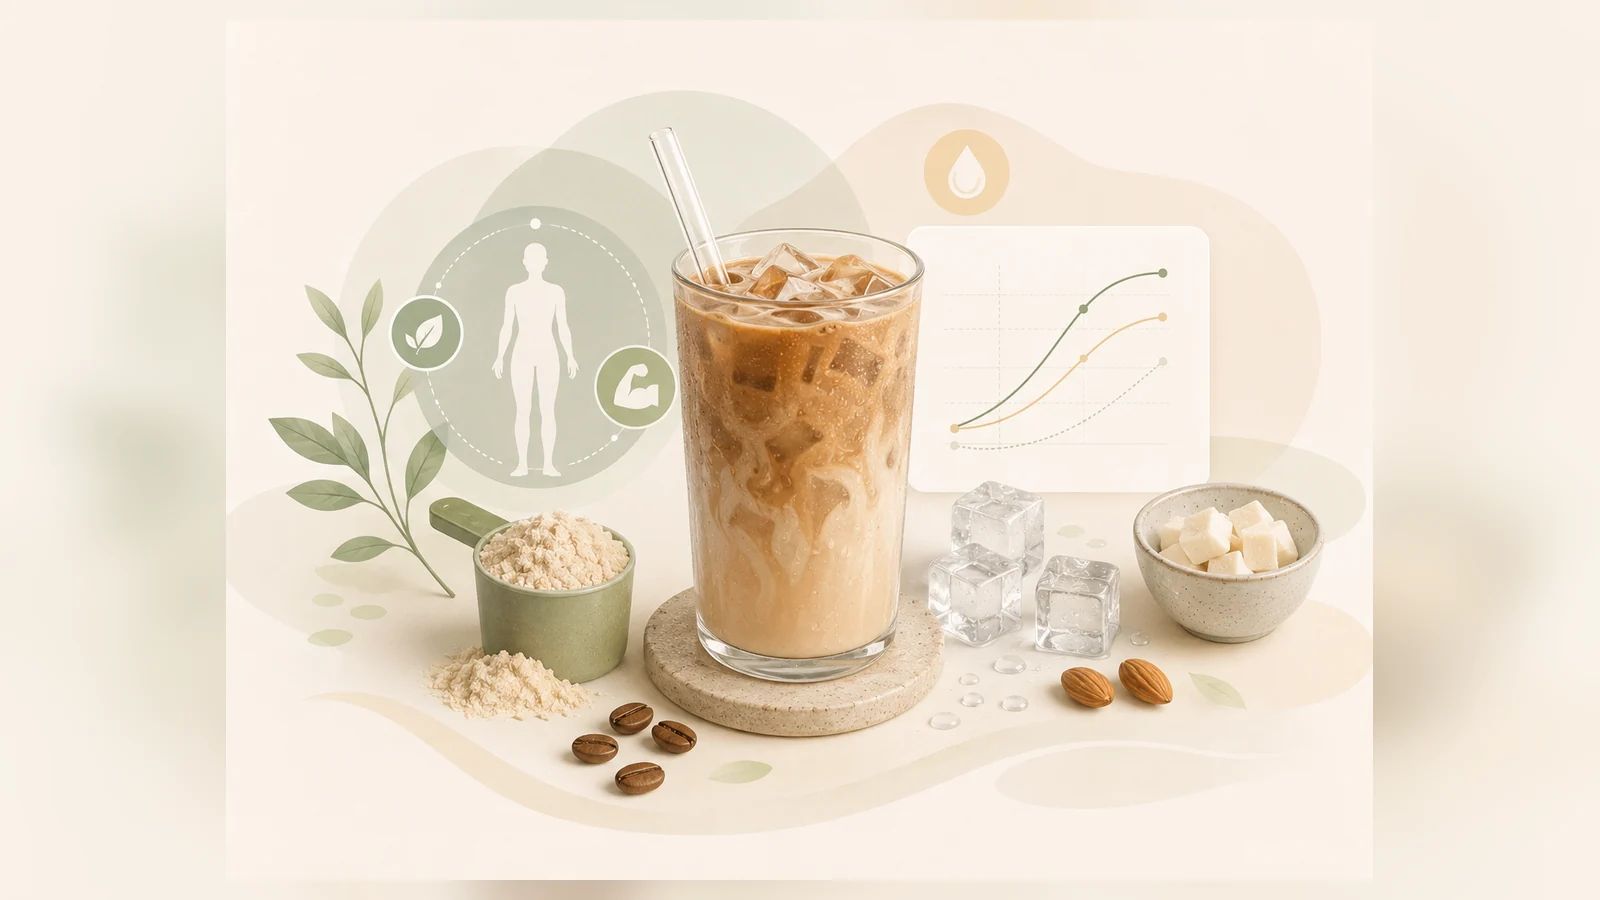
The drink is a protein powder in an iced-coffee format. The preparation is printed on the tub: 25 g of powder, that is one level scoop, in 300 ml of cold, unsweetened almond drink, mixed in a shaker or blender. According to the label the manufacturer is Quality First GmbH in Elmshorn, produced in Germany. The flavour is called Dark Cookie Crumble – the powder contains visible dark cookie pieces.1

My morning protocol
All my product tests follow the same pattern in the morning so that they stay comparable with each other: prepare the drink, drink it, then a 45-minute low impact ride on the Peloton bike straight afterwards, and record the CGM curve. That is exactly why I started this routine in the first place – I deliberately pair the morning protein drink with cycling so that blood sugar does not climb too far in the morning. It works cleanly for me, but it is part of the set-up, not a coincidence.
Flavour and texture: my favourite so far
On taste, this is the best product of the series for me. The coffee flavour is clearly there, but it is subtle rather than overpowering. The dark cookie side, by contrast, comes through very well. The result is a rounded, pleasant experience, as coherent as the marshmallow flavour. The texture is perfect for me too – creamy, with no powdery aftertaste.

The cookie pieces dissolve over time. Leave the drink standing and you end up with a kind of cookie milk. That tastes very good as well and is still easy to drink during training – you just lose the little pieces.

The nutrition in detail
One serving, that is 25 g of powder in 300 ml of unsweetened almond drink, provides 158 kcal, 19 g of protein, 4.1 g of carbohydrates of which 1.6 g sugar, 7.0 g of fat, 1.5 g of fibre and 81 mg of caffeine according to the label. The powder on its own comes to 378 kcal, 65 g of protein, 16 g of carbohydrates and 323 mg of caffeine per 100 g.1
At first glance the values look somewhat higher than for a plain shake. That impression is partly misleading: most of the fat does not come from the powder but from the almond drink – the powder itself contributes only about 1.5 g of fat per serving. With unsweetened almond drink the serving stays within reason; with cow's milk the sum would look markedly different. And the 81 mg of caffeine is roughly one ordinary cup of coffee.

What my blood sugar did
This time I recorded the whole morning without gaps. At 08:19 I was at 119 mg/dl – calm and flat, as it had been all night. At 08:22 I drank the shake and logged it straight away in the Libre app, generously rounded up to 6 g of carbohydrates. Five minutes later I was on the bike.

Then something happened that I had not expected: the value kept climbing even though the training was already under way. At 08:30 it was 131, at 08:37 it was 143, at 08:44 it was 145 – and at 08:46, roughly 19 minutes into the ride, it reached 149 mg/dl. That was the highest value of the morning.

| Time | Reading | What was happening |
|---|---|---|
| 08:19 | 119 mg/dl | starting value, fasted |
| 08:22 | 122 mg/dl | drink consumed, logged in the app |
| approx. 08:27 | – | start of a 45-minute low impact ride |
| 08:30 | 131 mg/dl | 3 minutes into the training |
| 08:37 | 143 mg/dl | 10 minutes into the training |
| 08:44 | 145 mg/dl | 17 minutes into the training |
| 08:46 | 149 mg/dl | highest value, 19 minutes into the training |
| 09:11 | 121 mg/dl | shortly before the end of the 45 minutes |
| 09:24 | 118 mg/dl | after a 10-minute cool-down |
After that the curve turned. At 09:11, shortly before the 45 minutes were up, I was back at 121 mg/dl. Following a ten-minute cool-down I was at 118 mg/dl at 09:24 – just below my starting value.


Throughout the whole period the app displayed „glucose in target range“ – including at 149 mg/dl. So „the clearest response of my test series“ means: the largest rise I have yet seen with one of these drinks (about +30 mg/dl against the starting value), not a spike out of range. That distinction matters to me.
The real finding: the rise came despite the training
For me this is the most important observation of the test. Riding in the morning is precisely what I do so that the value does not run away. In the first 20 minutes, though, the training did not prevent the rise – it reliably brought it back afterwards. Two different things, which I had previously lumped together in my head.
That fits a pattern I have described before in the context of exercise: in the early phase of a session the value can rise before it falls. Anyone measuring only right after the start therefore sees a different picture from someone who looks an hour later. Here two things overlap – the absorption of the drink and the onset of the exertion – and the result can only be read at the end of the session.
How high the value would have climbed without the bike. The comparison run is missing: the same drink, the same time of day, without training. Without that counter-test it remains open how much of the return to 118 mg/dl is down to the training and how much would simply have been the normal course.
Why the carbohydrates do not explain this on their own
4.1 g of carbohydrates is little. For comparison: a small bread roll is around 20 g, so the serving is about a fifth of that. Even the 6 g I generously entered into the app does not add up on paper to a rise of 27 mg/dl. That is exactly why it is worth looking honestly at the other candidates – and at what is documented and what is not.
The morning hour (plausible). Insulin action is physiologically weaker in the morning. In the dawn phenomenon, cortisol, growth hormone and glucagon raise insulin resistance in the early hours.3 The same drink in the afternoon may therefore look quite different in me.
Caffeine (plausible). 81 mg per serving is not a side issue. Caffeine can temporarily lower insulin sensitivity and amplify the blood sugar response, especially after meals; how strongly varies a great deal between individuals.2 That fits what I observed in the Coke Zero test with caffeine.
The protein route (open). With an intact insulin response, protein barely raises blood sugar. With pronounced insulin resistance, however, amino acids can deliver glucose with a delay via glucagon and gluconeogenesis.4 Whether that plays a role in my case cannot be answered from a single test.
Which of these factors it was. A single test cannot separate the morning hour, caffeine and protein from one another. That would need repetitions: the same flavour at a different time of day, and a caffeine-free comparison flavour in the same protocol. That is what comes next.
Why I get straight on the bike in the morning
Movement after eating is one of the best-documented levers there is: working muscles take glucose from the blood through GLUT-4 transporters even when insulin action is impaired.5 Just 10 to 20 minutes of walking after a meal measurably lowers the peak, and it works better after eating than before.6 For me this has become a fixed combination: the protein drink in the morning, then 45 minutes of easy riding straight afterwards. That is why all my test results are always recorded in the morning with drink plus ride – the buffer is part of the protocol.
Few carbohydrates does not automatically mean „nothing will happen“. Anyone who drinks something like this in the morning and assumes there is nothing left to do may be mistaken – in my case the curve rises anyway. Anyone taking glucose-lowering medication should agree training and timing with their doctor in any case.
My conclusion
On flavour, my all-time favourite of this series. On blood sugar, the drink that has produced the clearest response in me so far – within the target range, but visibly. Both are true at the same time, and that is exactly the point: a product can be well made and still be demanding for your own metabolism. For me that does not mean „do not drink it“, but plan for it deliberately – with unsweetened almond drink rather than milk, and with movement afterwards, knowing full well that the first 20 minutes of it will not catch anything. Next comes the comparison run without the bike, and after that the same flavour in the afternoon.
Key takeaways
- More Nutrition Protein Iced Coffee, Dark Cookie Crumble: 25 g of powder in 300 ml of unsweetened almond drink.
- Per serving: 158 kcal, 19 g of protein, 4.1 g of carbohydrates (1.6 g sugar), 7.0 g of fat, 81 mg of caffeine.
- Measured: 119 (08:19) – 122 when drinking – peak 149 (08:46) – 121 (09:11) – 118 (09:24).
- The rise of about 30 mg/dl came even though the training had been running for nearly 20 minutes.
- Every reading stayed inside the target range of the app – a clear rise, not a spike out of range.
- The training did not prevent the rise, but it brought it back cleanly.
- Flavour and texture are the best of the series for me – coffee subtle, cookie pronounced.
- What remains open is how the curve would have run without the bike. The comparison run follows.
Sources
Sources as of: 22 Jul 2026.
- Product label of the More Nutrition Protein Iced Coffee, Dark Cookie Crumble flavour (author's own photograph, see Fig. 6): nutrition per serving (25 g in 300 ml of unsweetened almond drink) and per 100 g of powder, plus preparation advice. Manufacturer per the label: Quality First GmbH, Elmshorn. morenutrition.de (opens in a new window)
- Caffeine can temporarily lower insulin sensitivity and amplify the blood sugar response, above all after meals; highly variable between individuals. beyondtype1.org (opens in a new window)
- Dawn phenomenon: a morning rise in blood sugar driven by cortisol, growth hormone and glucagon (raised insulin resistance), independent of food. Review. ncbi.nlm.nih.gov/PMC10457696 (opens in a new window)
- Franz MJ / Nuttall FQ: Dietary Protein and the Blood Glucose Concentration. Diabetes (2013); protein delivers small amounts of glucose with a delay via glucagon and hepatic gluconeogenesis. pmc.ncbi.nlm.nih.gov/PMC3636610 (opens in a new window)
- Physical activity, GLUT-4 and insulin sensitivity: insulin-independent glucose uptake in muscle; acute after a single session, chronic from about 8 weeks. PMC (2020). pmc.ncbi.nlm.nih.gov/PMC7235686 (opens in a new window)
- Reynolds/Pahra et al.: 10-20 minutes of walking after eating lowers postprandial glucose; more effective after the meal than before. PMC review (2020). ncbi.nlm.nih.gov/PMC7112182 (opens in a new window)