
Twelve bicycle and Peloton sessions were selected. The starting value is the continuous reading nearest to the exercise note. Glucose then had to fall by at least 5 mg/dl within 90 minutes and rebound by at least 15 mg/dl no later than 180 minutes after exercise started. Documented carbohydrate in the preceding two hours and an immediately preceding additional ride led to exclusion.
| Date | Session | Start | Nadir | later peak | Drop | Bounce |
|---|---|---|---|---|---|---|
| 2024-01-09 | Bicycle | 125 | 117 | 142 | −8 | +25 |
| 2026-01-04 | Peloton beginner | 156 | 123 | 142 | −33 | +19 |
| 2026-01-19 | Bike training | 158 | 145 | 181 | −13 | +36 |
| 2026-01-21 | Bicycle | 136 | 110 | 153 | −26 | +43 |
| 2026-03-30 | Low impact | 155 | 128 | 149 | −27 | +21 |
| 2026-04-02 | Low impact | 156 | 135 | 158 | −21 | +23 |
| 2026-04-08 | Cooldown + low impact | 145 | 133 | 176 | −12 | +43 |
| 2026-04-13 | Low impact | 148 | 138 | 159 | −10 | +21 |
| 2026-06-14 | 60 min rock | 116 | 107 | 130 | −9 | +23 |
| 2026-06-23 | Low impact | 124 | 115 | 136 | −9 | +21 |
| 2026-07-05 | 90s pop + low impact + cooldown | 108 | 99 | 115 | −9 | +16 |
| 2026-07-07 | German rock up to 400 W | 152 | 129 | 144 | −23 | +15 |
My observation: the curve falls, then returns
During harder or longer rides, muscle uptake can push the CGM reading down first. The curve may then rise again. The pattern also appeared in some sessions labelled Low Impact, so intensity alone cannot be identified as the trigger. In these twelve selected traces the rebound ranged from 15 to 43 mg/dl. The later peak did not always exceed the starting value.
Why liver glucose output is plausible
Exercise requires a supply of glucose to working muscle. At high intensity, counter-regulatory hormones can substantially increase hepatic glucose output. Published physiology describes situations in which liver glucose production exceeds utilisation during intense exercise. That makes a bounce plausible. My CGM data do not measure liver flux or hormones and therefore do not prove the mechanism.
Other explanations can overlap
- delayed absorption from an earlier meal,
- the lag between blood and interstitial CGM values,
- the dawn phenomenon during morning sessions,
- changing intensity within a ride,
- recovery periods and declining muscle uptake.
What changes for me
I no longer judge a ride by the lowest value immediately afterwards. The next two to three hours matter. After a steep fall I reduce intensity, keep observing and avoid rushed countermeasures. People using insulin or glucose-lowering medication need an individually agreed plan.
Method and limits
The selection rule was applied retrospectively to existing notes. Intensity was not consistently standardised by power, heart rate or zone. The description ‘hard’ is directly supported only where notes mention, for example, up to 400 watts or a long rock/pop block. Undocumented meals, time of day and CGM lag may affect the curves. This is a structured personal case series, not a frequency estimate for all rides.
Sources and methodological context
- American Diabetes Association, Standards of Care in Diabetes—2026: Physical activity and exercise
- Trefts et al., Exercise and the Regulation of Hepatic Metabolism
- Bergenstal et al., Glucose Management Indicator (GMI)
- Zaharieva et al., CGM lag during aerobic exercise
- Emhoff et al., Gluconeogenesis and hepatic glycogenolysis during exercise
The original measurement record remains unchanged. This section adds only method, sources, limitations and a reproducible follow-up plan.
The central question in this article
The article “Hard Peloton rides and the glucose bounce: glucose falls first, then rises again” examines how an exercise-related fall can coexist with a later rebound without claiming that liver output has been proven. The quality test is not whether one curve creates a compelling story. It is whether the timeline, data source, surrounding circumstances and alternative explanations are documented well enough for readers to separate observation from interpretation.
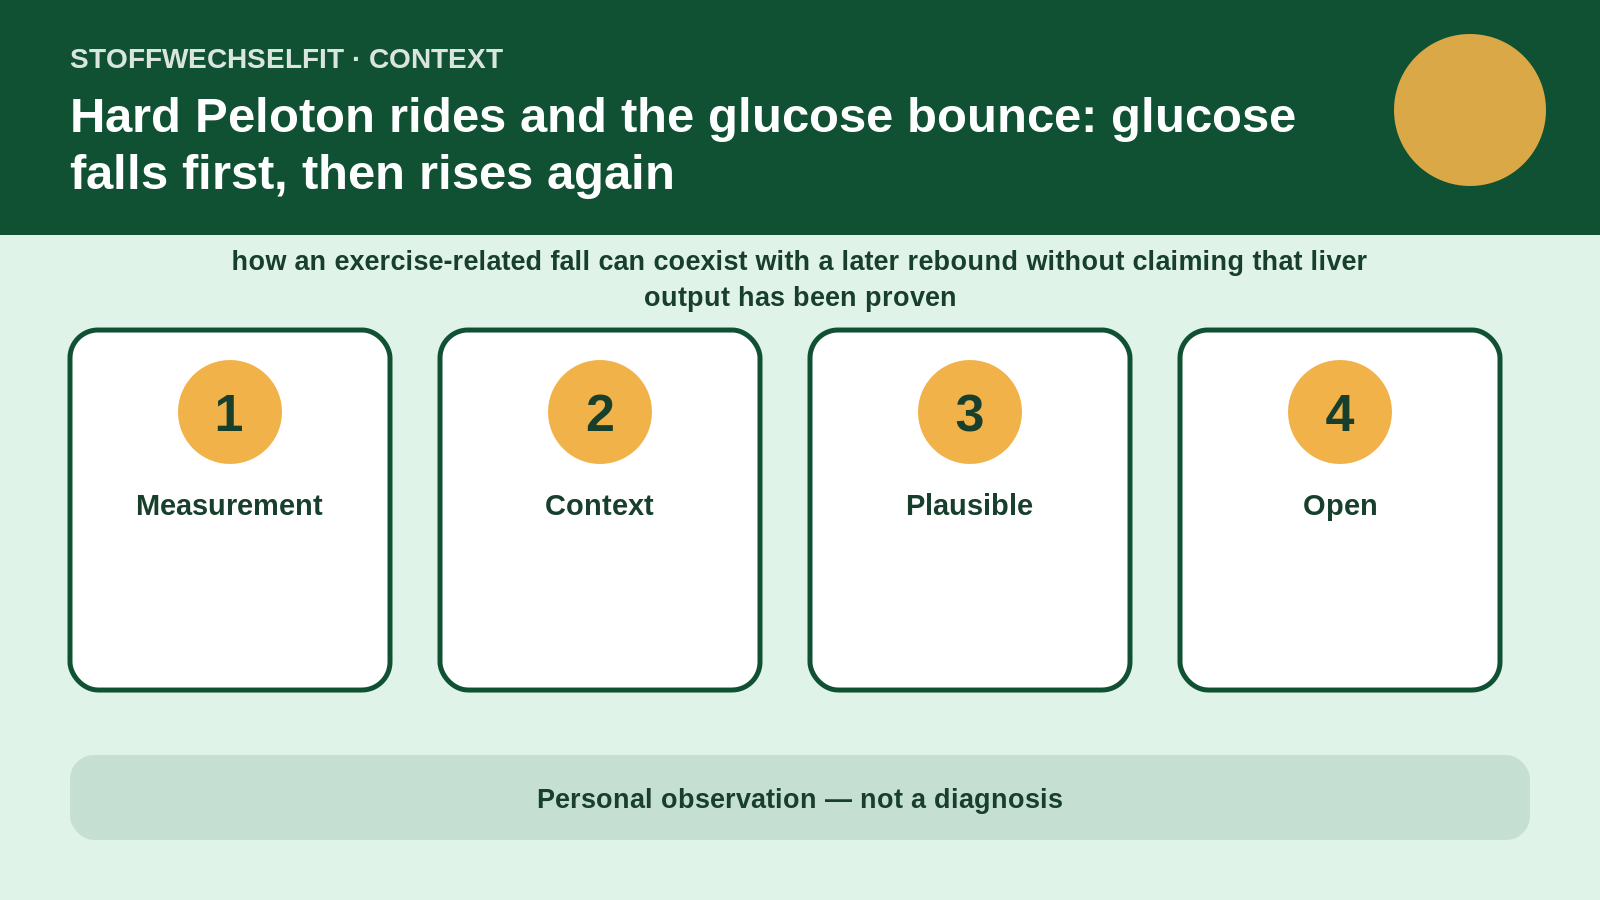
What the data show — and what they do not
A personal series can show timing and recurring patterns. It cannot by itself prove which physiological mechanism caused the pattern. Direct observation, plausible explanation and open question are therefore separated. Numbers remain linked to unit, time and data source, and missing details are not replaced with guesses.
Reading CGM correctly
Continuous glucose monitoring measures interstitial glucose. During rapid rises or falls, the display may follow blood glucose with a delay. Pressure on the sensor, a newly inserted sensor, hydration and short data gaps can add uncertainty. When a reading does not match symptoms or the situation, a confirmatory measurement may be appropriate depending on the clinical significance.
Technical context: Movement and exercise
Activity can increase glucose uptake by working muscle. At the same time, intense exercise can increase endogenous glucose supply through stress hormones. The direction of the curve therefore cannot be predicted from the word “exercise” alone. Duration, intensity, training status, starting value and the previous meal all matter. For comparisons, intensity should not be described only by a class name or a subjective label. Duration, heart rate, power, pauses, perceived exertion and time of day are more informative. When these data are missing, the interpretation must remain cautious.
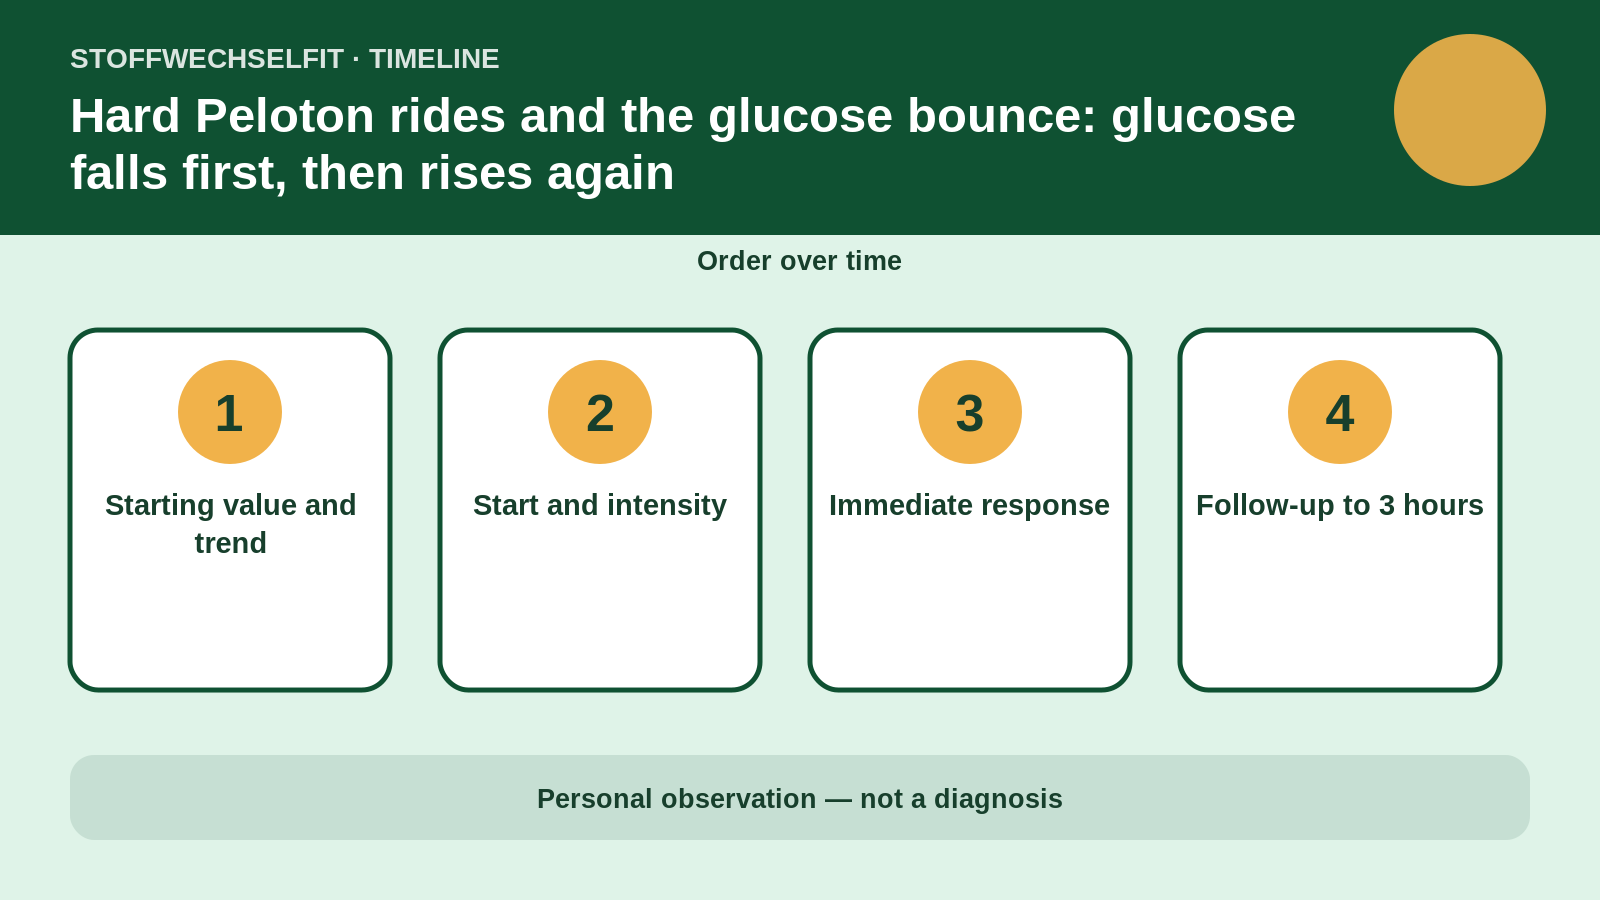
Article-specific interpretation
For “Hard Peloton rides and the glucose bounce: glucose falls first, then rises again”, this means first establishing which of the four phases — Starting value and trend, Start and intensity, Immediate response, Follow-up to 3 hours — are actually documented. A missing phase is not guessed from the curve. This matters especially because how an exercise-related fall can coexist with a later rebound without claiming that liver output has been proven. More decimal places do not improve research; more complete context does.
Alternative explanations
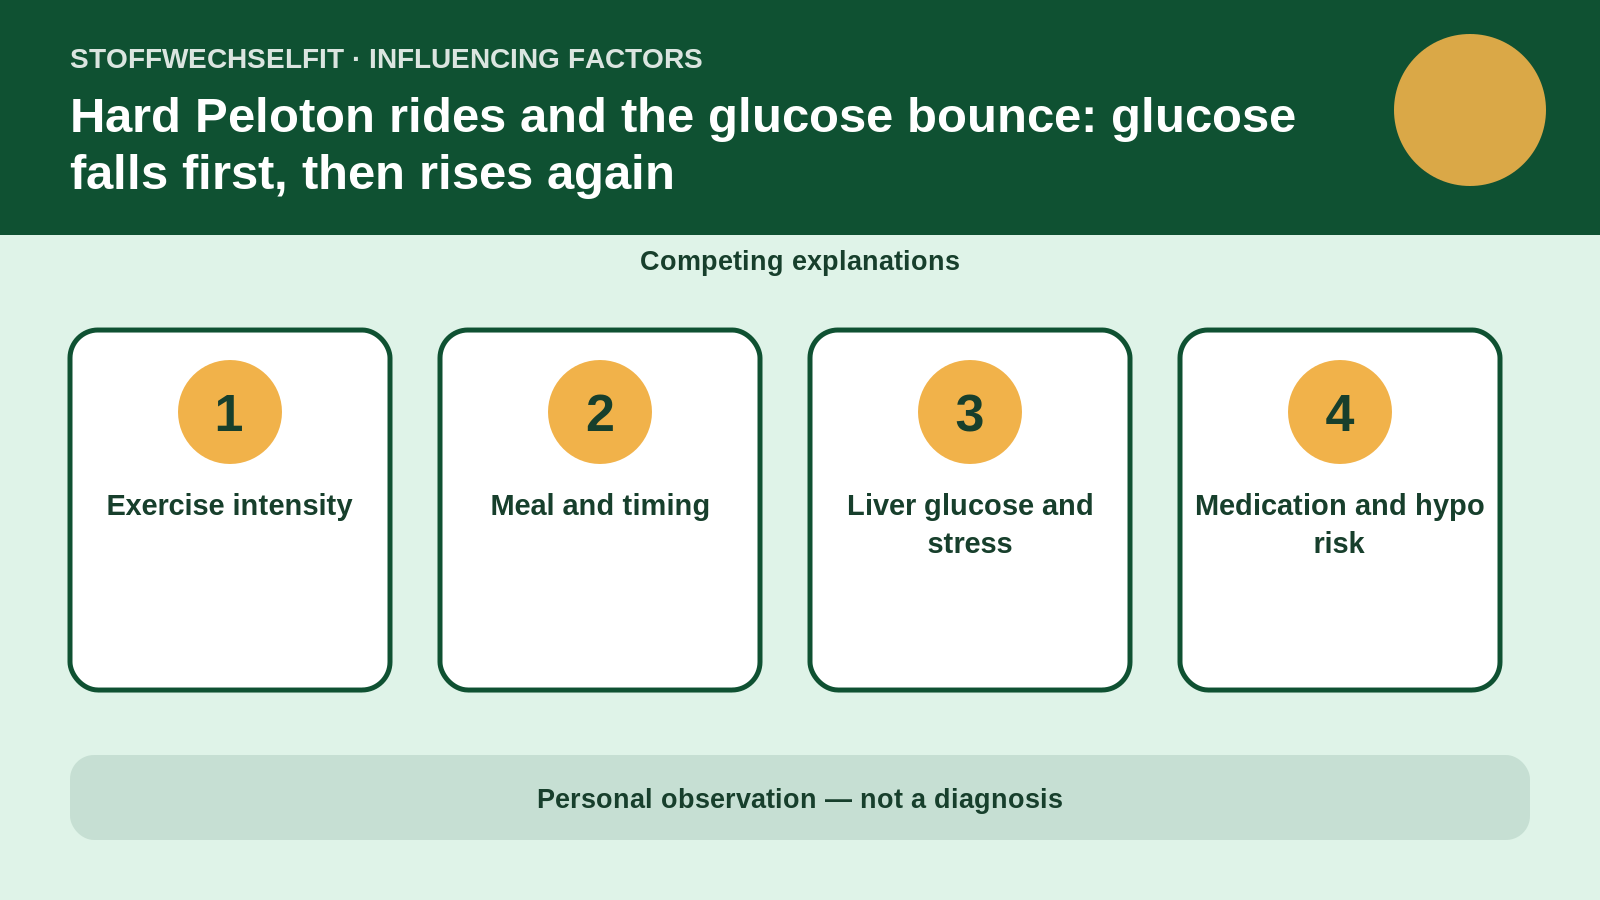
The competing influences considered are Exercise intensity, Meal and timing, Liver glucose and stress, Medication and hypo risk. Several can act at once and partly mask one another. No factor is therefore declared causal merely because it occurred close in time. A plausible explanation remains labelled as plausible until a targeted comparison supports it.
Data sheet and provenance
The data sheet for “Hard Peloton rides and the glucose bounce: glucose falls first, then rises again” records more than the start and peak. It also covers Starting value and trend, Start and intensity, Immediate response and Follow-up to 3 hours. Each section states whether a value was measured directly, read from a screenshot, calculated from raw data or reconstructed from memory. This keeps strong research separate from details that require later verification.
Typical failure modes
Common failure modes in this topic are incomplete portions, an incorrect time origin, events added retrospectively and observation ending too soon. For “Hard Peloton rides and the glucose bounce: glucose falls first, then rises again”, Exercise intensity and Liver glucose and stress are particularly important competing explanations. A finding is therefore given more weight only when the same direction appears on several sufficiently similar days and counterexamples are documented as well.
Editorial decision
The editorial decision is to keep the personal experience visible without turning it into universal advice. Headline, hero image, alternative text, captions and conclusion must communicate the same uncertainty. When the article contains an open question, it ends with the next testable step — Record the starting value — rather than a claim of effect.
Interpretation matrix
The interpretation matrix for “Hard Peloton rides and the glucose bounce: glucose falls first, then rises again” assigns every core statement to one of four classes: directly measured, calculated from several readings, physiologically plausible or still open. Direct measurement does not automatically establish causation. A calculated result requires a documented formula and time window. Plausible means consistent with physiology and timing but not isolated in the personal data. Open means that data, repetitions or comparison conditions are missing.
Publication review
Before publication, a final review asks whether the hero image matches the actual message of “Hard Peloton rides and the glucose bounce: glucose falls first, then rises again”, whether every number can be found in the text, whether units and timing are correct, and whether every image has alternative text and a caption. It also checks that Exercise intensity or Meal and timing has not accidentally been turned into a proven cause. Only then is the article editorially complete.
Reproducible follow-up plan
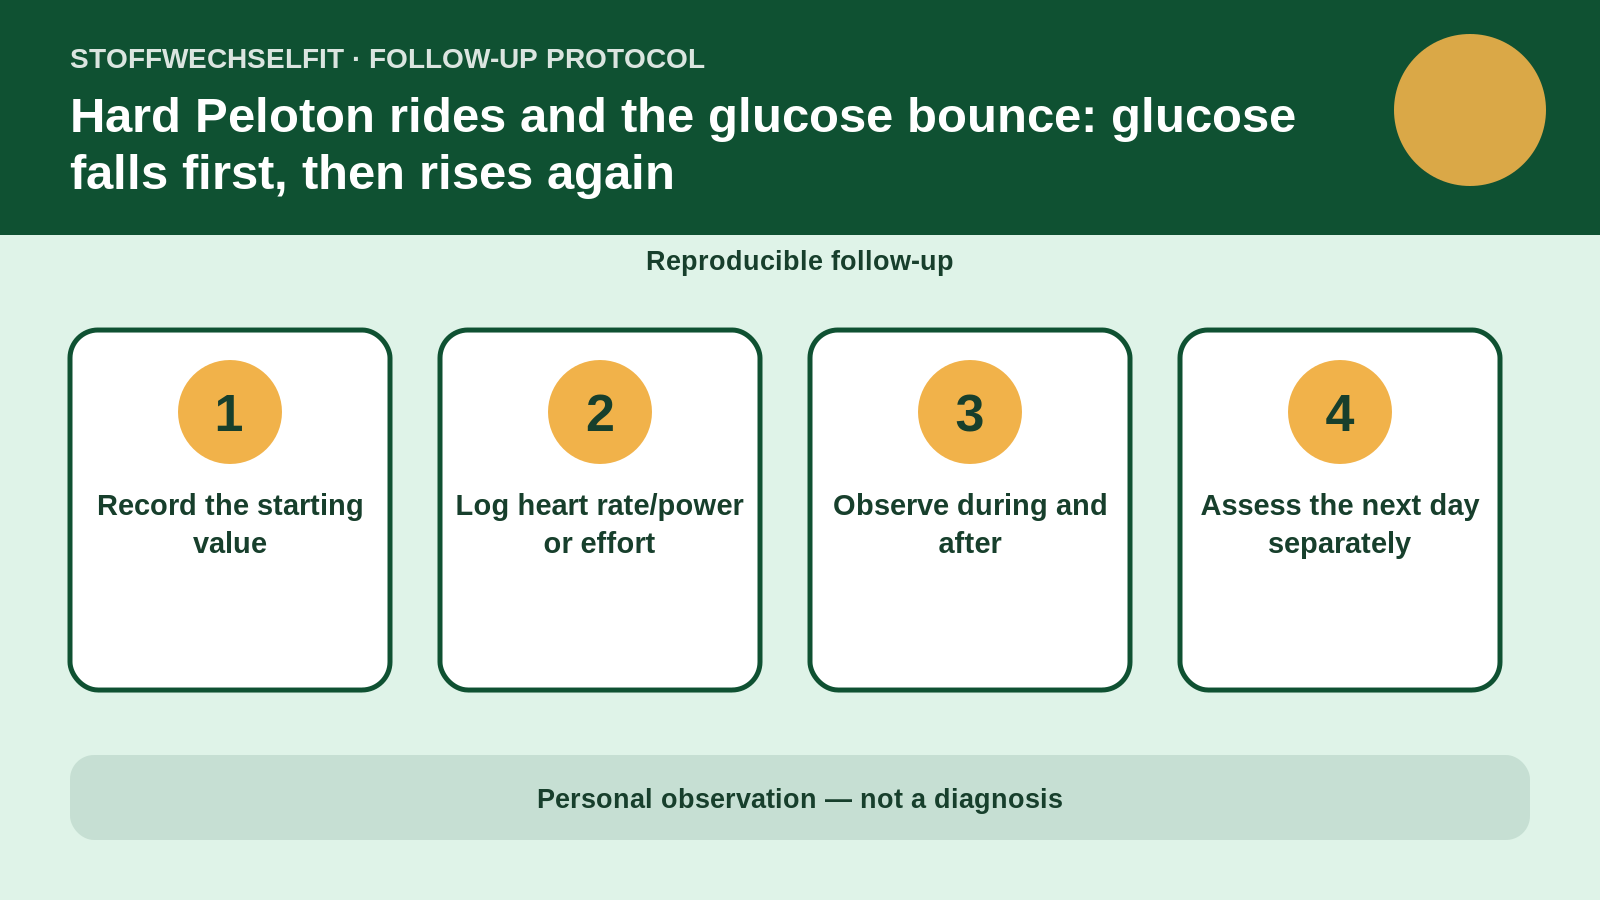
The next useful comparison follows four steps: Record the starting value, Log heart rate/power or effort, Observe during and after, Assess the next day separately. This sequence turns a spontaneous observation into a protocol and reduces the risk of selecting only spectacular days while forgetting ordinary patterns.
What can be transferred
The transferable lesson from “Hard Peloton rides and the glucose bounce: glucose falls first, then rises again” is therefore not necessarily the exact number. What transfers are the question, the documented conditions and the handling of uncertainty. Other people may respond very differently because of treatment, fitness, insulin sensitivity, digestion or comorbidity.
Comparison rather than snapshot
A credible comparison starts with one clear question and conditions that are as similar as possible. Starting value, trend, time, portion, drinks, activity, sleep, stress and medication all belong in the record. Not every factor can be controlled; the important point is to show differences rather than explain them away afterwards.
State the observation window
Thirty minutes answers a different question from two, four or twelve hours. The article therefore states when observation begins and recognises that mixed meals, alcohol or intense activity can act later. A peak is not interpreted without the pattern before and after it.
Personal readings are not universal limits
Typical guideline targets can provide orientation but require individualisation. Age, comorbidities, pregnancy, medication, hypoglycaemia risk and personal treatment goals change the interpretation. The self-observations shown here do not replace diagnosis or treatment decisions.
Practical safety framework
Marked symptoms, recurrent hypoglycaemia, very high readings, ketones or a pattern that does not fit the situation require clinical assessment rather than another self-experiment. People using insulin or glucose-lowering medication must not derive dose changes or corrections from a blog post.
Further technical limitations
A fall during a session and a later rise can both be plausible. Muscle uptake, digestion, stress responses and liver glucose output do not necessarily peak at the same minute. A complete timeline matters more than the lowest or highest isolated reading. For people using insulin or sulfonylureas, exercise may contribute to hypoglycaemia during activity or several hours later. Medication adjustments require individual clinical guidance. With very high glucose, ketones or marked illness, exercise is not a safe correction strategy.
Questions before drawing a conclusion
- Is the starting value for “Hard Peloton rides and the glucose bounce: glucose falls first, then rises again” documented with trend and time?
- Are Exercise intensity and Meal and timing described adequately?
- Did observation continue through “Follow-up to 3 hours”?
- Is there a comparison day after “Record the starting value”?
- Is each statement clearly labelled as personal, plausible or generally established?
Sources and context
- American Diabetes Association: Standards of Care in Diabetes—2026, health behaviours and exercise
- American Diabetes Association: Standards of Care in Diabetes—2026, glycaemic goals
- American Diabetes Association: Standards of Care in Diabetes—2026, diabetes technology
- NIDDK: Healthy Living with Diabetes
- WHO: Healthy diet
Medical notice: This article explains a personal observation and general context. It does not replace diagnosis, treatment adjustment or emergency care.