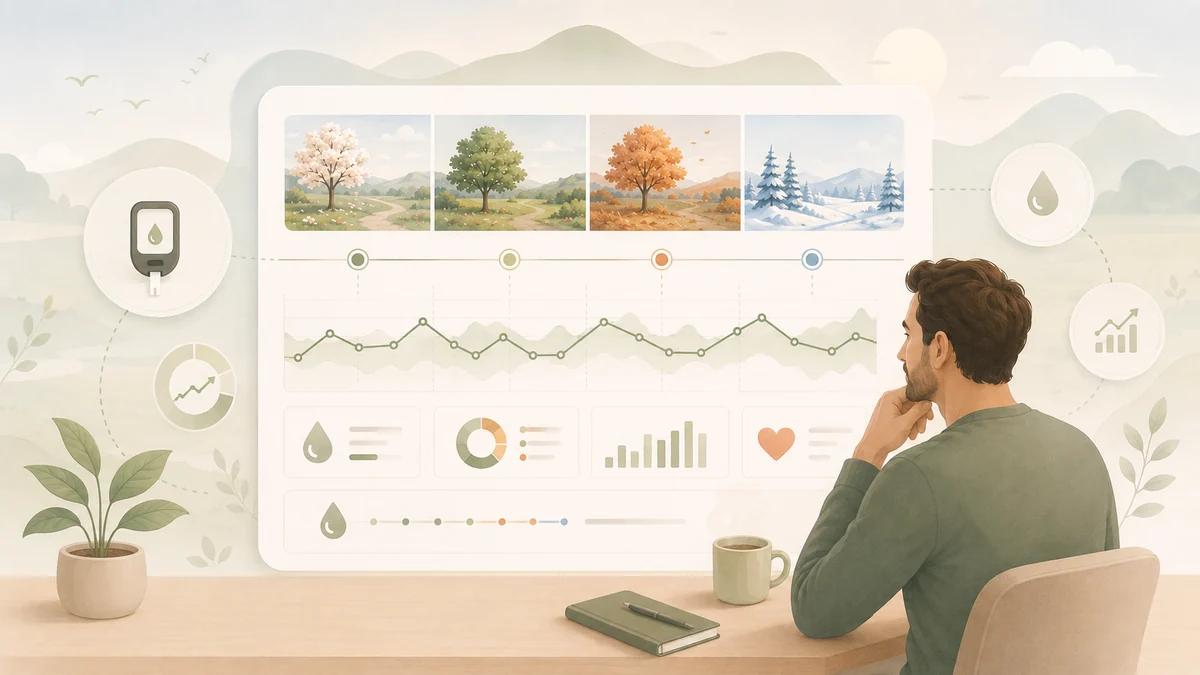
My sensor export goes back to April 2022. Reading the figures in sequence shows no upward line — but ups and downs with a tendency.
What the data show
From my own sensor export.
Why the figures are only partly comparable
Until the end of 2025 I did not measure continuously but in stretches: nine days in spring 2022, ten in autumn 2023, then forty, then a pause. Only since February 2026 has the measurement run without interruption.
A snapshot over nine days says something different from six months in a row. The early figures are indications, not a balance sheet.
No four-year trend can be derived from these stretches. Too many months are missing. What can be said: there were phases where readings sat higher than today — and they did not come out of nowhere.
What was different in the worse phases
Late 2023 and early 2025 were professionally busy periods with little structure. Exercise fell away, meals got later, sleep shorter. That is not in the data — it is my memory of those periods.
What is in the data: during those stretches 24 to 28 per cent of readings sat above 160 mg/dl. In the good phases it was below five.
What I take from it
Setbacks are not a sign of failure but the normal case with something you manage over years. The difference lies not in whether they come but in how long they last.
The second point: without measuring I would not have noticed the worse phases at all. An average of 150 does not feel different from one of 120.
This is the record of one case over four years, with gaps. It does not show what a course looks like for others and does not replace medical follow-up with laboratory values.
Key points
- Readings since April 2022, with gaps until late 2025.
- Values between 116 and 151 mg/dl depending on the stretch.
- The worse phases fell into periods without structure.
- No four-year trend can be derived from this.
- Without measuring, the worse phases would have gone unnoticed.
Single observation, not a study.
The values in this article come from my own sensor (FreeStyle Libre 3) and are a single-case observation (n = 1) – they show a pattern in me, not a rule for you. Every statement is labelled as established, plausible or open, and proximity in time never counts as proof of a cause. How I handle time windows, sensor lag, influencing factors and approval is collected on one page. Read the methodology
Sources
This entry is based on my own sensor readings. Where studies are mentioned, they are linked in the text. Continuous glucose monitoring: FreeStyle Libre 3.
Measurement coverage rather than apparent continuity
The file contains 20 sensor days in 2022, 39 in 2023, 44 in 2024, 30 in 2025 and 195 through 24 July 2026. The article therefore covers measurement phases across four calendar years, not four uninterrupted years of CGM use.