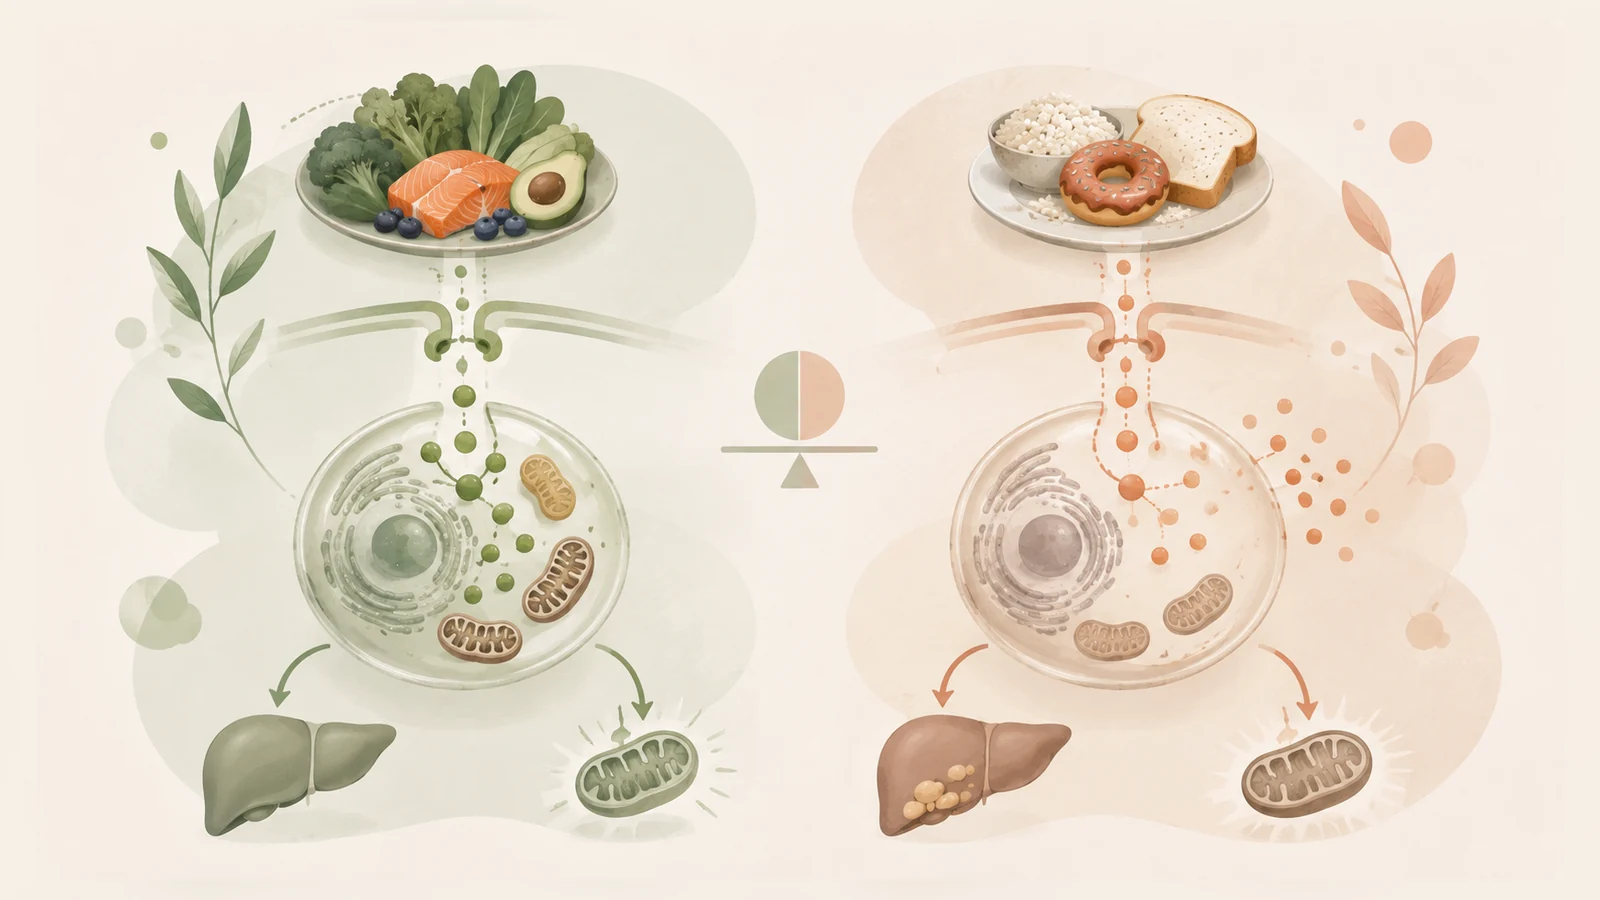
The aim is to help you place your own values better, where does “normal” end, where does the grey zone begin, and how do you tell that metabolism is under pressure. All figures are guideline and study values for orientation, not self-diagnosis.
The same stimulus, three possible responses
Whether breakfast, the stairs or the morning: the body constantly gets stimuli that move blood sugar. What matters isn’t the single rise, but how high it goes and how quickly it returns. That’s exactly where the levels differ.
The fasting values: the most important assessment
Fasting blood sugar (at least 8 hours without food) shows how the body keeps blood sugar at rest: without a meal as a confounder. It’s the first value that “drifts” as insulin resistance begins:
- Healthy: fasting below 100 mg/dl. The body keeps the value stable and calm overnight.
- Prediabetes (grey zone): 100–125 mg/dl. The liver releases too much glucose overnight; insulin no longer brakes cleanly.
- Diabetes: from 126 mg/dl (confirmed on two days). Regulation is markedly disturbed.
An early warning sign is often the morning value: if it rises without food (dawn phenomenon), that points to waning insulin action, more on this in Fasting blood sugar & the dawn phenomenon.
What a healthy person has after pasta and chocolate
Many believe a healthy person has no rise after a plate of pasta or chocolate. That’s not true: healthy people’s blood sugar rises too. The difference is in the height and the return:
- In healthy people the value stays below about 140 mg/dl after most meals and is back near baseline within one to two hours.1
- With a very carb-rich, “fast” meal (white-flour pasta, chocolate) even a healthy person can briefly approach 140–150 mg/dl, but the value falls again quickly.1
- Over the day, healthy people spend around 95% of the time between 70 and 140 mg/dl; above 140 it’s only a few percent (about half an hour a day).2
It’s not the brief spike that’s the problem, but a high value that stays up for a long time. A healthy metabolism “clears up”: an insulin-resistant one lets the sugar linger. That’s exactly what a CGM makes visible.
Prediabetes: understanding the grey zone
Prediabetes isn’t a full-blown disease, but a clear warning sign. Typical is:
- Fasting 100–125 mg/dl, HbA1c 5.7–6.4%, OGTT 2-hour value 140–199 mg/dl.3
- Higher and longer spikes after eating than in healthy people, more often above 140, sometimes up to nearly 200.
- On CGM, about one in three people with prediabetes already show brief excursions into the diabetic range.2
The good news: this is the phase where the most can be moved: through nutrition, movement and weight. What that looks like is in Understanding insulin resistance and Prediabetes.
Diabetes and derangement: when the value stays up
In manifest diabetes the thresholds are crossed: fasting from 126, HbA1c from 6.5%, OGTT 2-hour from 200. After eating the value often exceeds 180 mg/dl, the target corridor for well-controlled people with diabetes lies just below that.1
A derangement is when blood sugar stays markedly and persistently high (well above 250 mg/dl, sometimes 300–400+). Warning signs are strong thirst, frequent urination, fatigue and vision problems. That’s a case for medical assessment: not for self-experiments.
Persistently high values (e.g. consistently above 250 mg/dl), the warning signs above, or a newly abnormal fasting/long-term value belong in medical hands. A CGM is a great observation tool but doesn’t replace a diagnosis or treatment.
The surrounding parameters: how to recognise it
If you want to place your own values, don’t focus on a single value but on this interplay:
- Baseline/fasting value: low and calm (healthy) or elevated (from prediabetes)?
- Peak height after eating: below ~140 (healthy), 140–200 (grey zone) or above 200 (diabetes)?
- Return time: back within ~2 hours (healthy) or sluggish over hours (insulin-resistant)?
- Morning rise (dawn): flat (healthy) or marked without food (warning sign)?
- Time in Range (TIR): high (good) or many hours above the band?
You’ll find all the thresholds together in Understanding blood values.
The curves are schematic and show typical patterns: not real measurements. Individually, curves look different (amount and type of carbohydrate, movement, time of day, sleep), and a CGM doesn’t replace a medical diagnosis.
Key takeaways
- Fasting: healthy < 100, prediabetes 100–125, diabetes ≥ 126 mg/dl.
- Healthy people rise after pasta/chocolate too: usually below ~140, back in ~2 h.
- Prediabetes: higher, longer spikes (140–200), first diabetic excursions possible.
- Diabetes: often above 180–200 after eating, elevated for a long time; derangement = persistently very high.
- What matters is the interplay: baseline, peak height, return time, dawn, TIR.
- Schematic patterns, not a diagnosis – values belong in medical hands.
Article ID: SWF-W-025Please quote this ID for corrections or additions.
Sources
Sources as of: 21 Jul 2026.
- Postprandial glucose in healthy people usually < 140 mg/dl, returns within ~2 h; diabetes targets. Reference. diabetes.org (opens in a new window)
- CGM in healthy individuals: ~95% time 70–140 mg/dl; brief excursions; prediabetes patterns. Study, Metabolism. metabolismjournal.com (opens in a new window)
- Prediabetes thresholds (fasting, HbA1c, OGTT). American Diabetes Association. diabetes.org (opens in a new window)