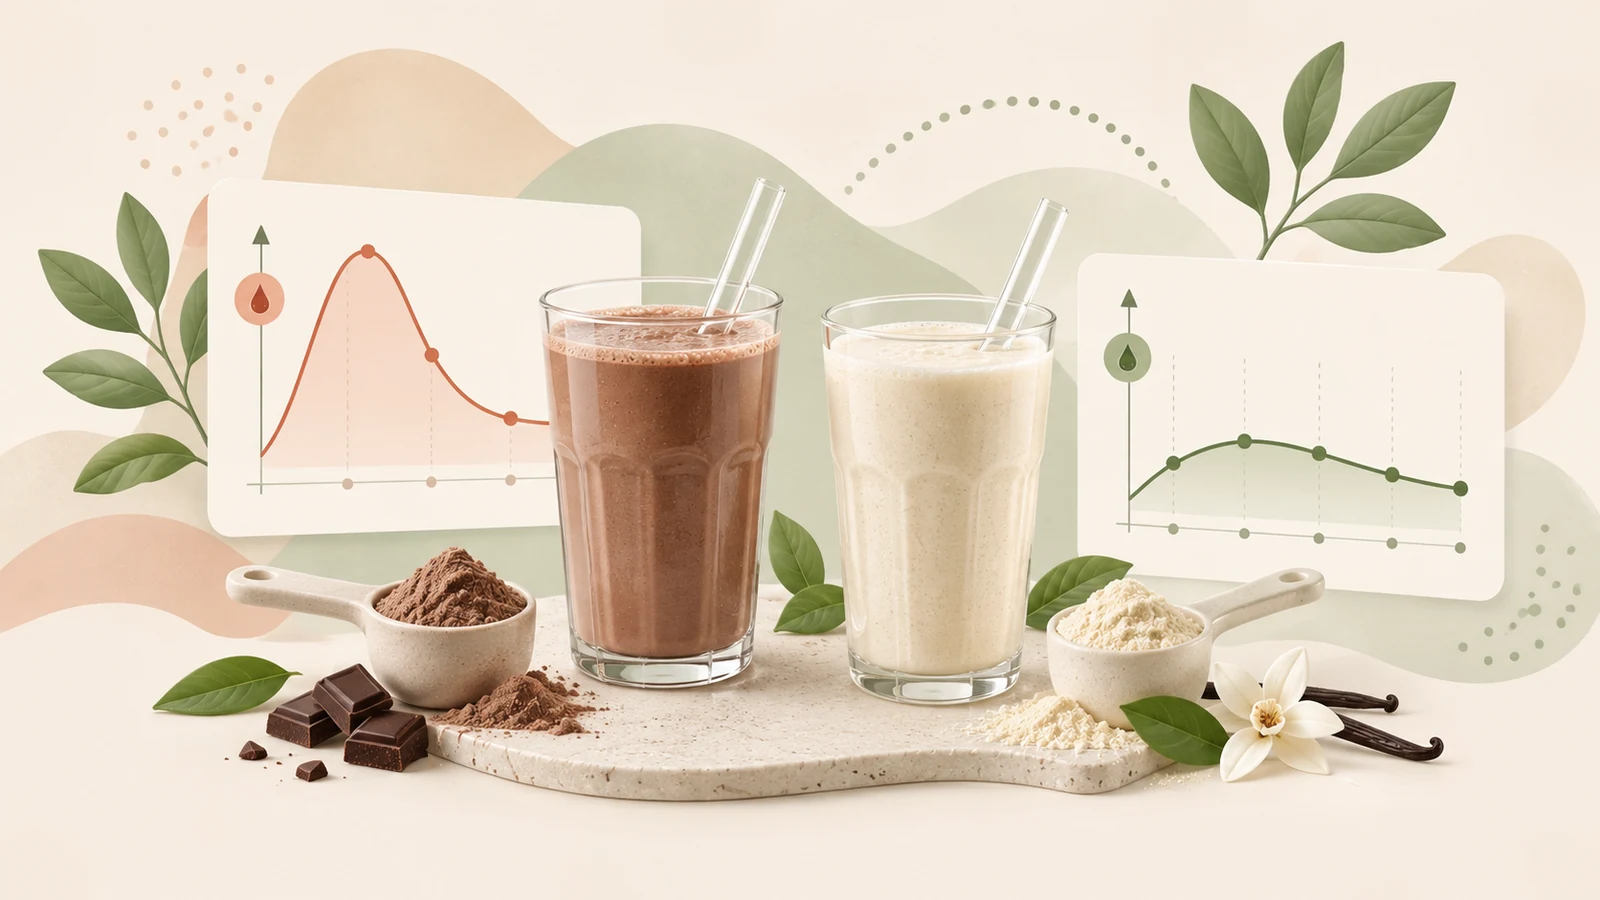
The number on the tub is not the whole story
Nutrition tables are useful, but they answer a narrower question than most people assume. They state how many grams of something a product contains. They say nothing about how quickly that something reaches the blood, what it triggers on the way and how the body answers.
With carbohydrates this difference is familiar: four grams of sugar in a soft drink act differently from four grams in wholemeal bread. With protein products the same thought is rarely followed through – yet it applies just as much. Two powders with identical tables can be composed differently, be digested at different speeds and trigger different hormonal responses.
First: the protein source itself
The biggest difference between two powders often lies not in the carbohydrates but in the protein. Whey is digested quickly, floods the blood with amino acids within a short time and thereby stimulates insulin release strongly. The branched-chain amino acids leucine, isoleucine and valine are principally involved, along with the gut hormones GIP and GLP-1.3
Casein behaves differently. It curdles in the stomach, is released more slowly and produces a flatter, longer response. In direct comparisons whey stimulated insulin release more strongly than casein – explained by its faster digestion and higher content of branched-chain amino acids.6
For blood sugar this is initially good news: more insulin at the same sugar content usually means a flatter curve. Whey even measurably lowers glucose after a meal, partly because it additionally slows gastric emptying.5 Two products with different whey-to-casein ratios can therefore behave differently without the nutrition table revealing it.
Second: the type of carbohydrate
Here lies a detail you cannot see on the label. Four grams of carbohydrate fully dissolved as powder in liquid meet the gut differently from four grams floating in the liquid as a crunchy piece.
Products with visible pieces – biscuit crumbs, brittle, chocolate chips – usually bring those carbohydrates in the form of starch from flour. Starch is broken down to glucose by the body’s own enzymes, and the more finely processed it is, the faster that happens. A powder whose carbohydrates come mainly from milk components or fibre behaves differently, although the table shows the same number.
The nutrition table states quantities, the ingredients list states origin – and it is sorted by weight. If a flour, a starch or a syrup appears near the top, that is a different carbohydrate quality from a product whose carbohydrates come from milk powder. For the question of why two shakes act differently, the ingredients list is therefore the more interesting source.
Third: fat and fibre as a brake
Both delay gastric emptying, and gastric emptying is one of the most important pacemakers for the height of a glucose peak.5 A shake with more fat or more soluble fibre tends to produce a flatter curve – but a longer one, because the material arrives later.
That leads to a result that looks paradoxical at first: a product with more calories can produce a lower peak than a lighter one, because the fat brakes. Anyone looking only at the maximum reaches a false conclusion here. What matters is the area under the curve, not the single point.
Fourth: the sweeteners
Protein powders are almost always sweetened, and the differences between the agents are considerable. Erythritol is barely metabolised and hardly raises blood sugar at all. Maltitol, by contrast, has a glycaemic index of around 35 – roughly half that of table sugar – and in larger amounts can certainly become visible.
Then there is an ingredient frequently overlooked: isomalto-oligosaccharides, usually abbreviated to IMO. They are often listed as fibre because a laboratory test classes them as indigestible. Human gut enzymes, however, break them down largely to glucose – just more slowly. As a result they drop out of the net-carbohydrate calculation and raise blood sugar anyway.
Fifth: the biggest factor is you
The most important point comes last because it puts everything else in perspective. An Israeli group monitored 800 people continuously for a week, capturing 46,898 meals. The central finding: the blood sugar response to identical, standardised meals differed considerably between participants. For the same meal there were both strong and weak responders.1
A model incorporating clinical data and gut flora composition predicted individual responses markedly better than general rules. The authors concluded that blanket dietary recommendations are of limited use – which argues for personal observation, but also for not adopting other people’s results unchecked.
Honesty requires the counter-voice: a published response questioned how much of the observed spread really reflects stable person-level differences and how much day-to-day fluctuation.2 That people respond differently is well documented. How reliably a personal profile can be derived from that is less clear than the popular reception suggests.
Gut flora contributed measurably to the prediction in that study – it is one of the factors explaining why two people respond differently to the same product. What does not follow: that a microbiome test could tell you which protein powder suits you. the research does not support that step, even though it is readily offered commercially.
What protein itself does to blood sugar
A common misconception holds that protein is irrelevant for blood sugar. With an intact insulin response that is largely true: the liver compensates for the amino acids arriving and the curve stays flat. With pronounced insulin resistance it looks different. There, amino acids can stimulate gluconeogenesis via glucagon and deliver small amounts of glucose with a delay.7
In practice this means: anyone seeing a rise after a protein shake does not necessarily have a carbohydrate problem. It can also be the delayed response to the protein itself – and that shows up later than a carbohydrate peak, often only after an hour and a half to two hours.
How to test a product on yourself properly
None of this means you should give up. It means your own measurement is worth more than any table – provided it is done cleanly. Four rules decide whether a conclusion or merely an impression stands at the end.
Change one thing only. Same time, same amount, same training before and after, comparable sleep. Anyone changing two things at once cannot attribute the result to a cause afterwards. That is the most common mistake in self-testing, and it renders the whole effort worthless.
Repeat at least three times. A single morning contains so much noise – sleep, stress, heat, the previous day – that a difference of ten or fifteen points cannot be explained by it. Only when the same pattern appears repeatedly does it become interesting.
Look long enough. The peak alone says little. Equally important is when the value comes back and whether it falls below the starting point. Two hours is the minimum; with fatty products it is worth looking longer still.
Write it down rather than remember it. Starting value, product, amount, time, course. Anyone relying on memory preferentially recalls the results that match their expectation. That is not a character flaw but normal – and the reason why notes make the difference.
What a self-test cannot do
It tells you how you responded to a product. It says nothing about how another person responds – that follows directly from the variability between individuals. And it says nothing about which ingredient was responsible, as long as the products differ in several respects.
Anyone wanting to know whether a particular component is the trigger would need products differing only in that respect. With ready-made retail products that is practically never the case. Two flavours from the same brand differ in aroma, sweetening, pieces and often in the protein blend all at once. You can establish that a difference exists – the cause remains open.
Anyone taking insulin or sulfonylureas should discuss experiments with meals and training times with a doctor beforehand: there, a misjudgement can lead to a genuine hypo. And anyone seeing inexplicably high values for weeks will find the answer better at the practice than in an ingredients list.
What I take from this
Two products with similar tables can act differently, and there are enough documented mechanisms for it: the protein source, the form of the carbohydrates, fat and fibre as a brake, the sweeteners. Which of these tips the balance in an individual case cannot be said without a controlled comparison.
The most honest way to handle that is the most modest one: measure your own response, note it cleanly, generalise nothing from it. What produces a flat curve in me may look different in you – not because one of us is doing something wrong, but because that is what the research leads you to expect.
The essentials at a glance
- Nutrition tables state quantities, not speed and not hormonal response – the ingredients list reveals more.
- Whey is digested quickly and stimulates insulin release strongly; casein acts more slowly and flatter.
- Carbohydrates as dissolved powder act differently from the same amount as biscuit pieces made from flour.
- Fat and fibre delay gastric emptying: a flatter peak but a longer course.
- Sweeteners differ widely – erythritol practically inert, maltitol noticeable, IMO glycaemically active despite being declared as fibre.
- The biggest factor is the person: in a study of 800 participants, people responded very differently to identical meals.
- A self-test needs: one change only, at least three repetitions, two hours of observation and written notes.
- A self-test shows your own response – not the cause and not other people’s responses.
Sources
Sources as of: 26 Jul 2026.
- Zeevi D. et al.: Personalized Nutrition by Prediction of Glycemic Responses. Cell 163(5):1079-1094 (2015). 800 participants, 46,898 measured meals: the blood sugar response to identical standardised meals differed considerably between people; clinical data and microbiome improved the prediction. cell.com (opens in a new window)
- A critical appraisal: Personalized nutrition by prediction of glycaemic responses – fact or fantasy? Eur J Clin Nutr (2016). The authors question how much of the observed spread really reflects stable person-level differences. nature.com/ejcn (opens in a new window)
- Salehi A. et al.: The insulinogenic effect of whey protein is partially mediated by a direct effect of amino acids and GIP on β-cells. Nutr Metab 9:48 (2012). Whey raised insulin, amino acids, GIP and GLP-1 more than white bread; the combination of isoleucine, leucine, valine, lysine and threonine markedly increased insulin secretion in the experiment. ncbi.nlm.nih.gov/PMC3471010 (opens in a new window)
- Review of the insulinotropic effects of whey protein: mechanisms, clinical trials and applications. Ann Nutr Metab 69(1):56 (2016). The effect is multifactorial; delayed gastric emptying also contributes. karger.com (opens in a new window)
- Comparative effects of leucine, isoleucine and valine on gastric emptying, plasma glucose, C-peptide and glucagon in healthy men. PMC (2021). Whey lowers post-meal glucose partly by slowing gastric emptying. ncbi.nlm.nih.gov/PMC8150294 (opens in a new window)
- Toffolon et al.: Effect of Reversal of Whey-Protein to Casein Ratio of Cow Milk on Insulin, Incretin, and Amino Acid Responses in Humans. Mol Nutr Food Res (2021). Whey stimulated insulin secretion more strongly than casein, partly due to faster digestion and a higher content of branched-chain amino acids. onlinelibrary.wiley.com (opens in a new window)
- Franz MJ / Nuttall FQ: Dietary Protein and the Blood Glucose Concentration. Diabetes (2013); protein delivers small amounts of glucose with a delay via glucagon and hepatic gluconeogenesis. pmc.ncbi.nlm.nih.gov/PMC3636610 (opens in a new window)